PROTECTED SOURCE SCRIPT
SOM RRMA (Revolution & Reverse Magic Average)

## SOM RRMA (Revolution & Reverse Magic Average)
**Description:**
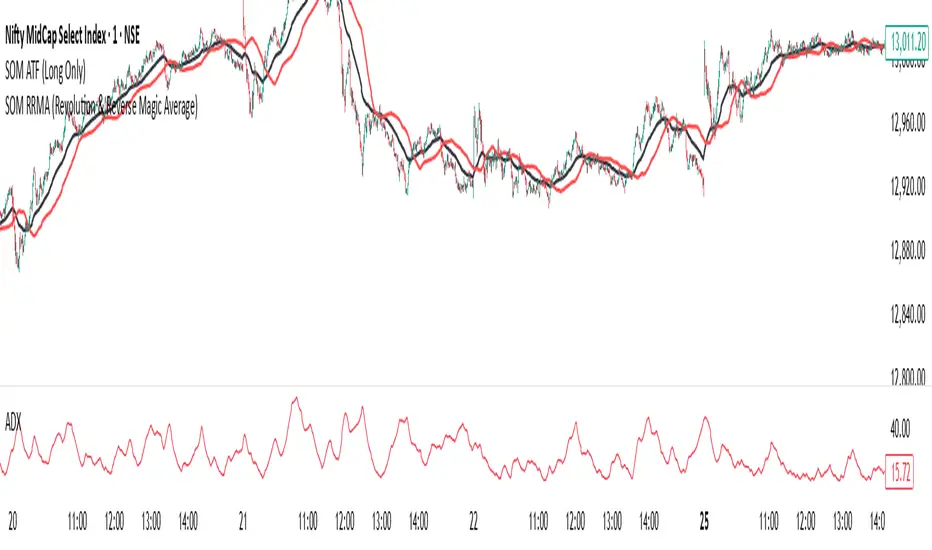
The SOM RRMA (Revolution & Reverse Magic Average) indicator overlays two distinct moving average lines on any TradingView chart, providing traders with enhanced trend and reversal insights.
- The “Revolution Magic Line RMA” plots the classic Welles Wilder’s Running Moving Average (RMA) using default settings: length = 21, source = close, and timeframe = chart. This line is displayed in **green** for clear visibility.
- The “Reverse Magic Line RMA” plots an innovative reverse RMA, based on a reversed price calculation, also using default settings: length = 21, source = close, and timeframe = chart. This line appears in **red** for direct distinction.
- Both lines offer independent customization of length, source, and timeframe, enabling traders to tailor the indicator to their strategy and instrument.
**How to Use:**
- Add SOM RRMA to any TradingView instrument and timeframe.
- By default, both lines use length = 21 and source = close with the current chart’s timeframe.
- The green line tracks the standard RMA trend; the red line follows the Reverse RMA, often moving contrary to price action.
- Observe interactions and divergence between the two lines to detect trend changes, momentum shifts, or potential reversal setups.
**Features:**
- Customizable length, source, and timeframe parameters for both lines.
- Default colors: green for standard RMA, red for Reverse RMA.
- Trend-following, divergence detection, and reversal strategy support.
**Notes:**
This indicator is intended for educational and research purposes only. Please test it using demo charts before applying to live trading.
Feedback and suggestions are welcome—share your experience or questions on the script page.
受保护脚本
此脚本以闭源形式发布。 但是,您可以自由使用它,没有任何限制 — 在此处了解更多信息。
免责声明
这些信息和出版物并不意味着也不构成TradingView提供或认可的金融、投资、交易或其它类型的建议或背书。请在使用条款阅读更多信息。
受保护脚本
此脚本以闭源形式发布。 但是,您可以自由使用它,没有任何限制 — 在此处了解更多信息。
免责声明
这些信息和出版物并不意味着也不构成TradingView提供或认可的金融、投资、交易或其它类型的建议或背书。请在使用条款阅读更多信息。