OPEN-SOURCE SCRIPT
已更新 HMA w(LRLR)
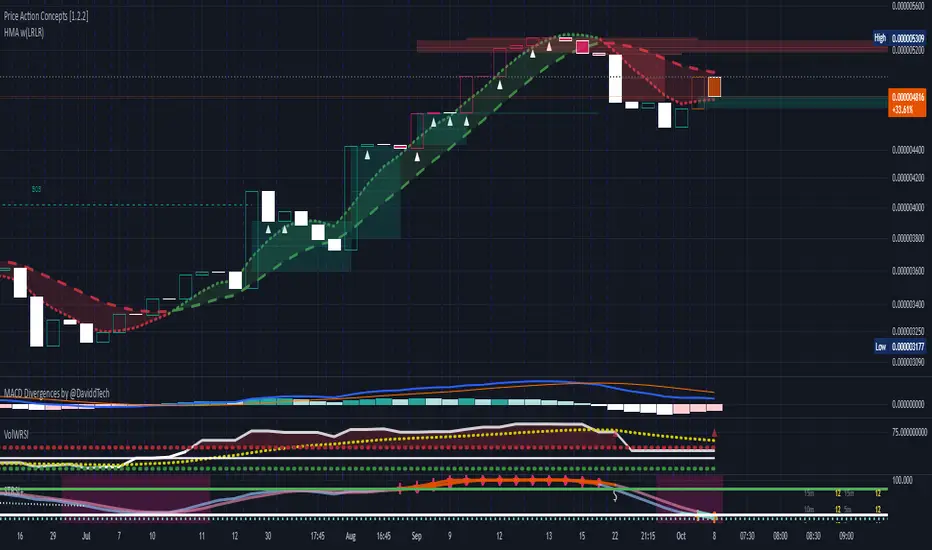
Description: This script combines a customizable Hull Moving Average (HMA) with a Low Resistance Liquidity Run (LRLR) detection system, ideal for identifying trend direction and potential breakout points in a single overlay.
Features:
Hull Moving Average (HMA):
Select separate calculation sources (open, high, low, close) for short and long periods.
Choose from SMA, EMA, and VWMA for length type on both short and long periods, offering flexible moving average calculations to suit different trading strategies.
Color-coded HMA line that visually changes based on crossover direction, providing an intuitive view of market trends.
Customizable options for line thickness, color transparency, and band fill between HMA short and long lines.
Low Resistance Liquidity Run (LRLR):
Detects breakout signals based on price and volume conditions, identifying potential liquidity run levels.
User-defined length and breakout multiplier control breakout sensitivity and adjust standard deviation-based thresholds.
Color-coded visual markers for bullish and bearish LRLR signals, customizable for user preference.
Alerts for both bullish and bearish LRLR events, keeping users informed of potential trading opportunities.
This script allows traders to visually track the HMA trend direction while also spotting low-resistance liquidity opportunities, all on one chart overlay.
Disclaimer: This tool is intended for educational purposes only and should not be used solely to make trading decisions. Adjust parameters as needed, and consider additional analysis for comprehensive decision-making.
版本注释
-Fixed bands to same color of trend (bullish/Bearish)-Fixed hma calculations ( added to source options)
- Line style now a key feature for bands
开源脚本
秉承TradingView的精神,该脚本的作者将其开源,以便交易者可以查看和验证其功能。向作者致敬!您可以免费使用该脚本,但请记住,重新发布代码须遵守我们的网站规则。
免责声明
这些信息和出版物并非旨在提供,也不构成TradingView提供或认可的任何形式的财务、投资、交易或其他类型的建议或推荐。请阅读使用条款了解更多信息。
开源脚本
秉承TradingView的精神,该脚本的作者将其开源,以便交易者可以查看和验证其功能。向作者致敬!您可以免费使用该脚本,但请记住,重新发布代码须遵守我们的网站规则。
免责声明
这些信息和出版物并非旨在提供,也不构成TradingView提供或认可的任何形式的财务、投资、交易或其他类型的建议或推荐。请阅读使用条款了解更多信息。