OPEN-SOURCE SCRIPT
已更新 MTF Combo
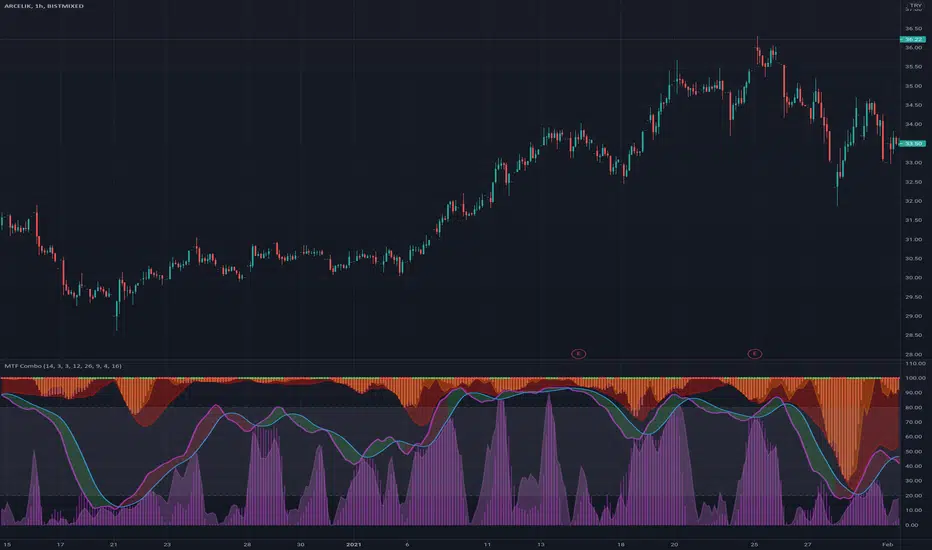
Middle stochastic is the HTF stochastic of price. The color coding indicates the trend in even higher timeframe.
- The graph on top is the stochastic of ATR (with HTF and current one with RSI and macd histogram).
- The green graph at the bottom is the stochastic of the OBV (with HTF and current one with RSI and macd histogram).
- Purple histogram and area underneath the mid-stochsatic are the macd histogram and the stochastic RSI.
- The dots in the middle are determined by the combined score of all
版本注释
Stochastic OBV is moved to the top开源脚本
秉承TradingView的精神,该脚本的作者将其开源,以便交易者可以查看和验证其功能。向作者致敬!您可以免费使用该脚本,但请记住,重新发布代码须遵守我们的网站规则。
免责声明
这些信息和出版物并非旨在提供,也不构成TradingView提供或认可的任何形式的财务、投资、交易或其他类型的建议或推荐。请阅读使用条款了解更多信息。
免责声明
这些信息和出版物并非旨在提供,也不构成TradingView提供或认可的任何形式的财务、投资、交易或其他类型的建议或推荐。请阅读使用条款了解更多信息。