OPEN-SOURCE SCRIPT
Stochastic Barcolor 2021-5-22
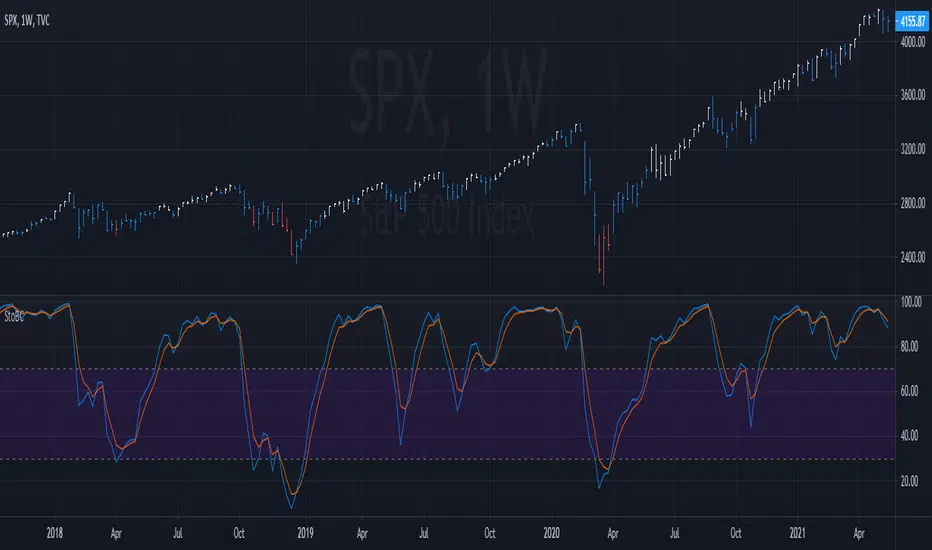
This one is the stochastic with barcolor added to it. In this example, the bars are white when the stochastic line is above is above both 70 AND its signal (vice-versa the bars are red). Adjust the lines and overbought/oversold levels however you see fit for your needs. On higher time frames, this can be used to spot the most bullish/bearish trends. On lower time frames it can be used to take profits. This setting is most effective when used on multiple time frames. Enjoy!
开源脚本
本着TradingView的真正精神,此脚本的创建者将其开源,以便交易者可以查看和验证其功能。向作者致敬!虽然您可以免费使用它,但请记住,重新发布代码必须遵守我们的网站规则。
免责声明
这些信息和出版物并不意味着也不构成TradingView提供或认可的金融、投资、交易或其它类型的建议或背书。请在使用条款阅读更多信息。
免责声明
这些信息和出版物并不意味着也不构成TradingView提供或认可的金融、投资、交易或其它类型的建议或背书。请在使用条款阅读更多信息。