PROTECTED SOURCE SCRIPT
已更新 Cumulative volume analysis
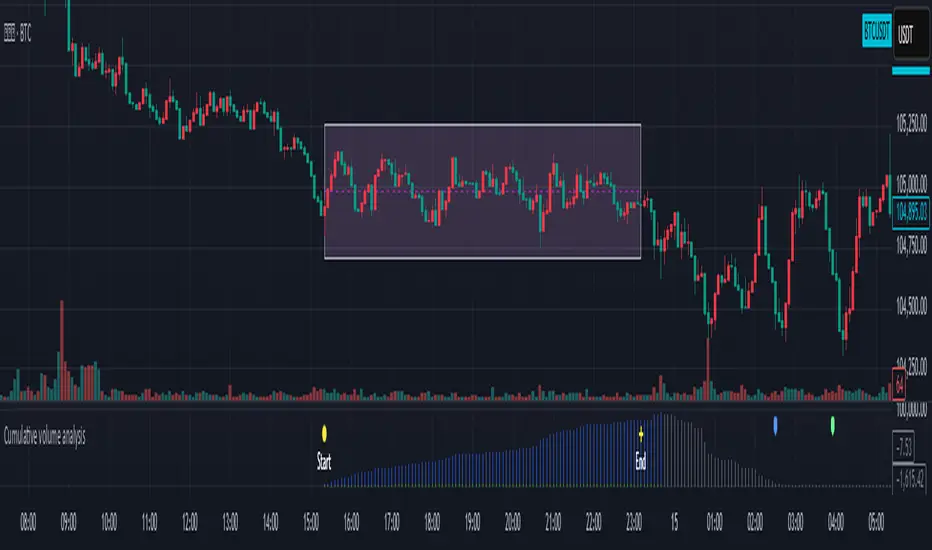
After user define the ragion area. While break out the region area, you can try this indicator to notice when the power is ended and maybe reverse the trend.
1. The user enters the start time, and end time
2. The indicator will record the highest, lowest price, and cumulative amount during this period.
The cumulative amount is calculated by adding up the amount of each K bar, regardless of whether it rises or falls.
3. When the cumulative amount is reduced to less than or equal to 0, make a plotshape arrow
4.There are two diferent method to record the volume. Try the better way to different product.
版本注释
Added more explanation below:This indicator is suitable for short-term use. I prefer the range of 5 minutes K to 1 hour K.
The chart uses 5 points K as an example.
I think this concept is my own idea, and there is no plagiarism.
If you like it, like it or share it
版本注释
Change some description into English version.受保护脚本
此脚本以闭源形式发布。 但是,您可以自由使用,没有任何限制 — 了解更多信息这里。
免责声明
这些信息和出版物并非旨在提供,也不构成TradingView提供或认可的任何形式的财务、投资、交易或其他类型的建议或推荐。请阅读使用条款了解更多信息。
受保护脚本
此脚本以闭源形式发布。 但是,您可以自由使用,没有任何限制 — 了解更多信息这里。
免责声明
这些信息和出版物并非旨在提供,也不构成TradingView提供或认可的任何形式的财务、投资、交易或其他类型的建议或推荐。请阅读使用条款了解更多信息。