OPEN-SOURCE SCRIPT
已更新 Buy the dips - sell the tops

This script is a merge of the RSI and the Williams %R.
I've observed that in strong uptrends, we go from RSI overbought to RSI overbought, but it hardly gets oversold. (the same in the opposite direction)
To find a better entry point, Williams %R is used to find oversold conditions in an uptrend or overbought in a downtrend.
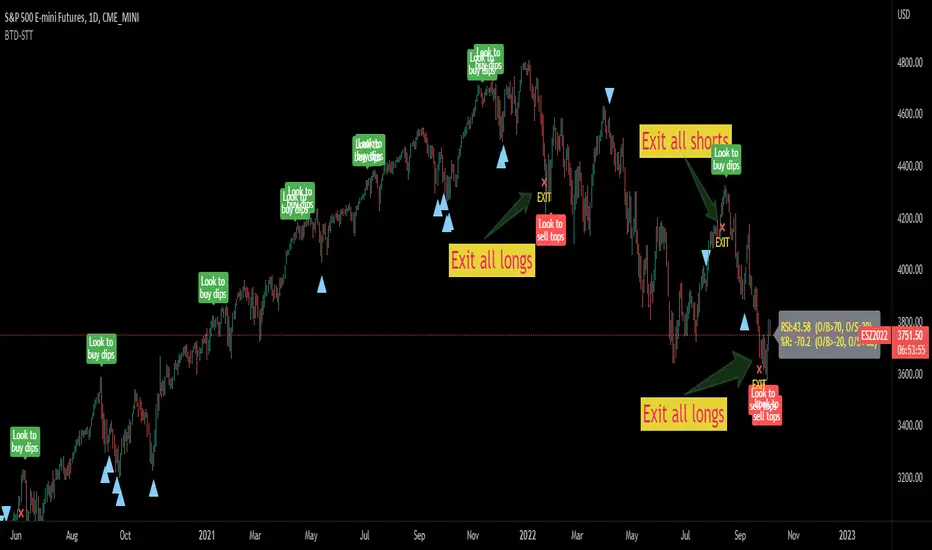
=> When W%R returns from oversold/overbought to normal, a triangle will be plotted and this is the point of entry to add to your position. (there's an option to mark all candles in the overbought/oversold region, by default it is off)
=> When RSI goes from overbought back to normal it will tell you to buy the dip. In a downtrend it will tell you to sell the tops.
=> When the RSI gets oversold and the previous RSI was overbought, it will mark to exit the position
I did backtest this one with a risk to reward of 2 and exit when target is reached.
Trading EUR/USD on the daily would return 28% after 10 years of trading with a success ratio of 43%.
Trading BTC/USD on the daily would lose 12% after 7 years and a success rate of 28%.
Trading it this way is not the best idea ;-) 2 Interesting observations however:
- Once you get the entry right, in 80% of the cases, you do reach the next RSI oversold/overbought level. Keeping your position open until you reach that level can be an option to maximize profits.
- When a triangle is plotted and it is the low compared to the previous more or less 5 candles (same for the high), chances are high it will be taken out a few candles later, so don't take a trade yet.
Using classic technical analysis might improve more your entry and exit positions.
Feel free to comment your best strategy using this indicator ;-)
Happy trading!
版本注释
The label will tell you now when the RSI or %R is overbought/oversold. You don't need to compare numbers anymore ;-)版本注释
Added moving averages similar to Williams Alligator without an offset. The label will tell you what the short term and long term trends are.A strategy can be to buy dips when the long term trend is bullish, sell tops when long term is bearish. Stay out when the trend is mixed. Take profit when short term switches from bullish/bearish to mixed.
By default the moving averages are disabled.
As always, do your own backtesting ;-)
开源脚本
秉承TradingView的精神,该脚本的作者将其开源,以便交易者可以查看和验证其功能。向作者致敬!您可以免费使用该脚本,但请记住,重新发布代码须遵守我们的网站规则。
免责声明
这些信息和出版物并非旨在提供,也不构成TradingView提供或认可的任何形式的财务、投资、交易或其他类型的建议或推荐。请阅读使用条款了解更多信息。
开源脚本
秉承TradingView的精神,该脚本的作者将其开源,以便交易者可以查看和验证其功能。向作者致敬!您可以免费使用该脚本,但请记住,重新发布代码须遵守我们的网站规则。
免责声明
这些信息和出版物并非旨在提供,也不构成TradingView提供或认可的任何形式的财务、投资、交易或其他类型的建议或推荐。请阅读使用条款了解更多信息。