OPEN-SOURCE SCRIPT
NSDT Double MA Shading
This script is an interesting take on Convergence and Divergence of Moving Averages. With the built-in MACD Indicator, you cannot make these adjustments to the settings.
DESCRIPTION
The top Moving Average is calculated on the High of the candle.
The bottom Move Average is calculated on the Low of the candle.
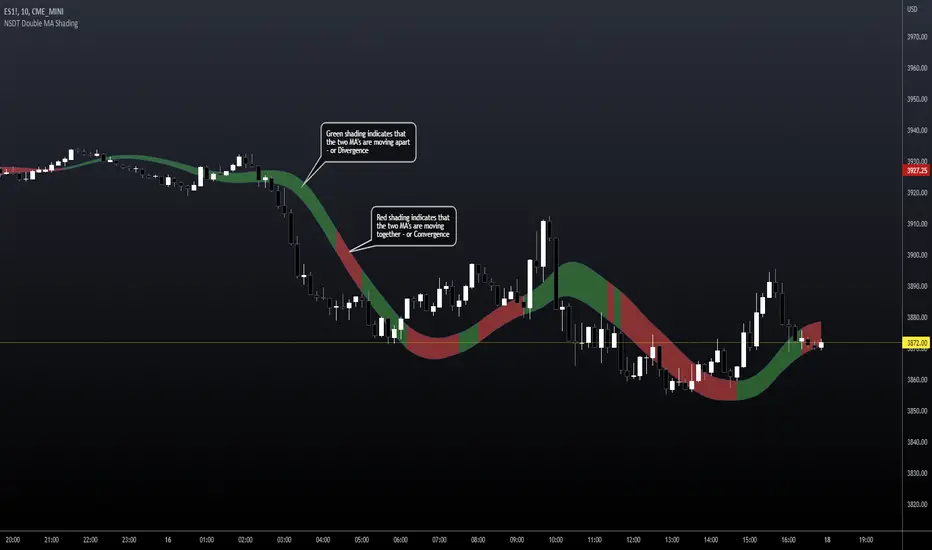
If the two are moving apart (Divergence), the shaded area between them turns Green.
If the two are moving together (Convergence), the shaded area between them turns Red.
This may help identify when a trend is becoming stronger or weaker, based on the shaded area and Moving Average direction.
POSSIBLE USAGE
For example:
If the MA's are pointing downward and the shaded area is Green - it means that average distance between the candle High and Low is getting wider, which may indicate a stronger downward movement. Then, when the shaded area turns Red, signaling the average distance between the candle High and Low are getting narrower, this may indicate that the downward movement is weakening, and may be the end of that downward trend.
SETTINGS
You can choose from EMA, SMA, WMA, RMA, HMA, TMA, and VWMA.
Although you can choose the MA Source, it is highly recommended to keep one source on the High of the candle and the other on the Low of the candle, for measure Convergence and Divergence.
All indicator settings are editable.
It can be used on Multi Timeframes (MTF).
This script is free and open source.
DESCRIPTION
The top Moving Average is calculated on the High of the candle.
The bottom Move Average is calculated on the Low of the candle.
If the two are moving apart (Divergence), the shaded area between them turns Green.
If the two are moving together (Convergence), the shaded area between them turns Red.
This may help identify when a trend is becoming stronger or weaker, based on the shaded area and Moving Average direction.
POSSIBLE USAGE
For example:
If the MA's are pointing downward and the shaded area is Green - it means that average distance between the candle High and Low is getting wider, which may indicate a stronger downward movement. Then, when the shaded area turns Red, signaling the average distance between the candle High and Low are getting narrower, this may indicate that the downward movement is weakening, and may be the end of that downward trend.
SETTINGS
You can choose from EMA, SMA, WMA, RMA, HMA, TMA, and VWMA.
Although you can choose the MA Source, it is highly recommended to keep one source on the High of the candle and the other on the Low of the candle, for measure Convergence and Divergence.
All indicator settings are editable.
It can be used on Multi Timeframes (MTF).
This script is free and open source.
开源脚本
秉承TradingView的精神,该脚本的作者将其开源,以便交易者可以查看和验证其功能。向作者致敬!您可以免费使用该脚本,但请记住,重新发布代码须遵守我们的网站规则。
ALL indicators, strategies and bots are included with Discord access.
NorthStarDayTrading.com/discord
youtube.com/shorts/fWFQE7uEHvU
NorthStarDayTrading.com/discord
youtube.com/shorts/fWFQE7uEHvU
免责声明
这些信息和出版物并非旨在提供,也不构成TradingView提供或认可的任何形式的财务、投资、交易或其他类型的建议或推荐。请阅读使用条款了解更多信息。