OPEN-SOURCE SCRIPT
Scalper Pro Pattern Recognition & Price Action
OVERVIEW
Scalper Pro is a comprehensive multi-timeframe trading indicator that combines Smart Money Concepts (SMC) with traditional technical analysis to provide scalpers and day traders with high-probability entry and exit signals. This indicator integrates multiple analytical frameworks into a unified visual system designed specifically for short-term trading strategies.
ORIGINALITY & PURPOSE
What Makes This Script Original
This script is not a simple mashup of existing indicators. Instead, it represents a carefully orchestrated integration of complementary analytical methods that work together to solve a specific problem: identifying high-probability scalping opportunities in volatile markets.
The unique value proposition:
Adaptive Trend Filtering System - Combines a customized SuperTrend algorithm with dual-period range filters (Cirrus Cloud) and Hull Moving Average trend cloud to create a three-layer trend confirmation system
Smart Money Concepts Integration - Incorporates institutional trading concepts (Order Blocks, Fair Value Gaps, Break of Structure) with retail technical indicators for a complete market structure view
Dynamic Risk Management - Automatically calculates stop-loss and take-profit levels based on ATR volatility, providing objective position sizing
ADX-Based Market Regime Detection - Identifies ranging vs. trending markets through ADX analysis with visual bar coloring to prevent whipsaws during consolidation
Why Combine These Specific Components
Each component addresses a specific weakness in scalping:
SuperTrend provides the primary directional bias but can generate false signals in ranging markets
Range Filters smooth out noise and confirm trend direction, reducing SuperTrend false positives
ADX Analysis prevents trading during low-volatility consolidation when most indicators fail
SMC Elements identify institutional activity zones where price is likely to react strongly
ATR-Based Risk Management adapts position sizing to current volatility conditions
The synergy creates a system where signals are only generated when multiple confirmation layers align, significantly reducing false signals common in single-indicator approaches.
HOW IT WORKS
Core Calculation Methodology
1. SuperTrend Signal Generation
The script uses a modified SuperTrend algorithm with the following calculation:
ATR = Average True Range (default: 10 periods)
Factor = 7 (default sensitivity multiplier)
Upper Band = Source + (Factor × ATR)
Lower Band = Source - (Factor × ATR)
Directional Logic:
When price crosses above SuperTrend → Bullish signal
When price crosses below SuperTrend → Bearish signal
SuperTrend value is plotted as dynamic support/resistance
Key Modification: The sensitivity parameter (nsensitivity * 7) allows users to adjust the aggressiveness of trend detection without changing the core ATR calculation.
2. Range Filter System (Cirrus Cloud)
The Range Filter uses a smoothed range calculation to filter out market noise:
Smooth Range Calculation:
WPER = (Period × 2) - 1
AVRNG = EMA(|Price - Price[1]|, Period)
Smooth Range = EMA(AVRNG, WPER) × Multiplier
Two-Layer System:
Layer 1: 22-period with 6x multiplier (broader trend)
Layer 2: 15-period with 5x multiplier (tighter price action)
Visual Output: The space between these two filters is colored:
Green fill = Bullish trend (Layer 1 > Layer 2)
Red fill = Bearish trend (Layer 1 < Layer 2)
This creates a "cloud" that expands during strong trends and contracts during consolidation.
3. ADX Market Regime Detection
Calculation:
+DM = Positive Directional Movement
-DM = Negative Directional Movement
True Range = RMA of True Range (15 periods)
+DI = 100 × RMA(+DM, 15) / True Range
-DI = 100 × RMA(-DM, 15) / True Range
ADX = 100 × RMA(|+DI - -DI| / (+DI + -DI), 15)
Threshold System:
ADX < Threshold (default 15) = Ranging market → Bar color changes to purple
ADX > Threshold = Trending market → Normal bar coloring applies
Purpose: This prevents taking trend-following signals during sideways markets where most indicators produce whipsaws.
4. Smart Money Concepts (SMC) Integration
Order Blocks (OB):
Identified using swing high/low detection with customizable pivot length
Bullish OB: Last down-close candle before bullish Break of Structure (BOS)
Bearish OB: Last up-close candle before bearish BOS
Extended forward until price breaks through them
Fair Value Gaps (FVG):
Detected when a three-candle gap exists:
Bullish FVG: Low[0] > High[2]
Bearish FVG: High[0] < Low[2]
Filtered by price delta percentage to ensure significant gaps
Displayed as boxes that delete when price fills the gap
Break of Structure (BOS) vs. Change of Character (CHoCH):
BOS = Price breaks the previous structural high/low in the current trend direction
CHoCH = Price breaks structure in the opposite direction (potential trend reversal)
Both internal (minor) and swing (major) structures are tracked
Equal Highs/Lows (EQH/EQL):
Detected when consecutive swing highs/lows are within ATR threshold
Often indicates liquidity pools that price may sweep before reversing
5. ATR-Based Risk Management
Calculation:
ATR Band = ATR(14) × Risk Multiplier (default 3%)
Stop Loss = Entry - ATR Band (for longs) or Entry + ATR Band (for shorts)
Take Profit Levels:
TP1 = Entry + (Entry - Stop Loss) × 1
TP2 = Entry + (Entry - Stop Loss) × 2
TP3 = Entry + (Entry - Stop Loss) × 3
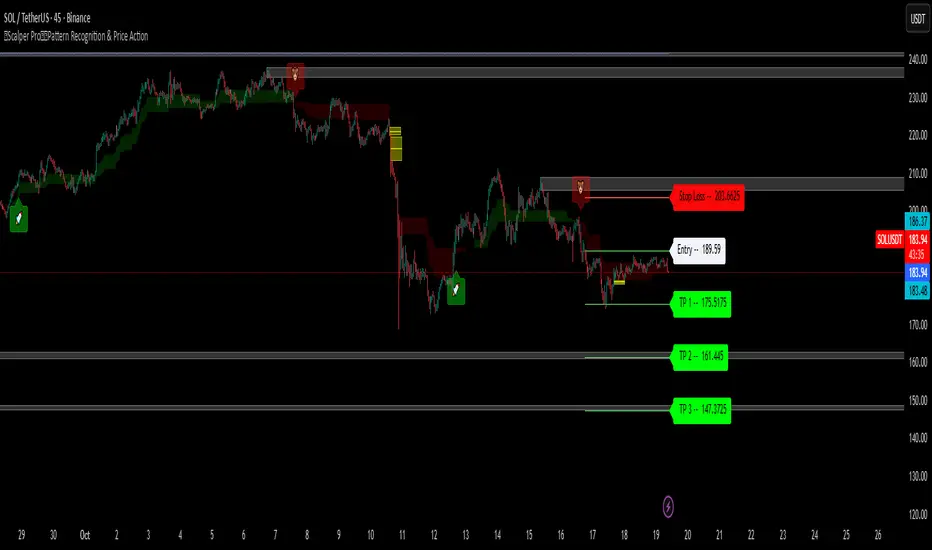
Dynamic Labels: Stop loss and take profit levels are automatically calculated and displayed as labels on the chart when new signals trigger.
6. Hull Moving Average Trend Cloud
HMA = WMA(2 × WMA(Close, Period/2) - WMA(Close, Period), sqrt(Period))
Period = 600 bars (long-term trend)
The HMA provides a smoothed long-term trend reference that's more responsive than traditional moving averages while filtering out short-term noise.
HOW TO USE THE INDICATOR
Entry Signals
Primary Buy Signal:
SuperTrend changes to green (price crosses above)
ADX shows market is NOT ranging (bars are NOT purple)
Price is within or near a bullish Order Block OR bullish FVG
Cirrus Cloud shows green fill (Layer 1 > Layer 2)
Primary Sell Signal:
SuperTrend changes to red (price crosses below)
ADX shows market is NOT ranging
Price is within or near a bearish Order Block OR bearish FVG
Cirrus Cloud shows red fill (Layer 1 < Layer 2)
Confirmation Layers
Higher Probability Trades Include:
Bullish/Bearish BOS in the same direction as signal
Equal highs/lows being swept before entry
Price respecting premium/discount zones (above/below equilibrium)
Multiple timeframe alignment (use MTF settings)
Exit Strategy
The indicator provides three take-profit levels:
TP1: Conservative target (1:1 risk-reward)
TP2: Moderate target (2:1 risk-reward)
TP3: Aggressive target (3:1 risk-reward)
Suggested Exit Approach:
Close 1/3 position at TP1
Move stop to breakeven
Close 1/3 position at TP2
Trail remaining position or exit at TP3
Risk Management
Stop Loss:
Use the ATR-based stop loss level displayed on chart
Alternatively, use percentage-based stop (adjustable in settings)
Never risk more than 1-2% of account per trade
Position Sizing:
Position Size = (Account Risk $) / (Entry Price - Stop Loss Price)
CUSTOMIZABLE SETTINGS
Core Parameters
Buy/Sell Signals:
Toggle signals on/off
Adjust SuperTrend sensitivity (0.5 - 2.0)
Risk Management:
Show/hide TP/SL levels
ATR period (default: 14)
Risk percentage (default: 3%)
Number of decimal places for price labels
Trend Features:
Cirrus Cloud display toggle
Range filter periods (x1, x2, x3, x4)
Hull MA length for trend cloud
Smart Money Concepts:
Order Block settings (swing length, display count)
Fair Value Gap parameters (auto-threshold, extend length)
Structure detection (internal vs swing)
EQH/EQL threshold
ADX Settings:
ADX length (default: 15)
Sideways threshold (10-30, default: 15)
Bar color toggle
Display Options:
Previous day/week/month high/low levels
Premium/Discount/Equilibrium zones
Trend candle coloring (colored or monochrome)
BEST PRACTICES & TRADING TIPS
Optimal Use Cases
Scalping on lower timeframes (1m, 5m, 15m)
Rapid entry/exit with clear TP levels
ADX filter prevents choppy market entries
Day trading on medium timeframes (30m, 1H)
Stronger trend confirmation
Better risk-reward ratios
Swing trading entries on higher timeframes (4H, Daily)
Higher-probability structural setups
Larger ATR-based stops accommodate volatility
Market Conditions
Best Performance:
Trending markets with clear directional bias
Post-news volatility with defined structure
Markets respecting support/resistance levels
Avoid Trading When:
ADX indicator shows purple bars (ranging market)
Multiple conflicting signals across timeframes
Major news events without clear price structure
Low volume periods (market open/close)
Common Mistakes to Avoid
Ignoring the ADX filter - Taking signals during ranging markets leads to whipsaws
Not waiting for confirmation - Enter only when multiple layers align
Overtrading - Fewer high-quality setups outperform many mediocre ones
Ignoring risk management - Always use the calculated stop losses
Fighting the trend - Trade WITH the SuperTrend and Cirrus Cloud direction
TECHNICAL SPECIFICATIONS
Indicator Type: Overlay (plots on price chart)
Calculation Resources:
Max labels: 500
Max lines: 500
Max boxes: 500
Max bars back: 500
Pine Script Version: 5
Compatible Timeframes: All timeframes (optimized for 1m to 1D)
Compatible Instruments:
Forex pairs
Crypto assets
Stock indices
Individual stocks
Commodities
THEORETICAL FOUNDATION
Trend-Following Concepts
This indicator is based on the principle that markets trend more often than they range, and that trends tend to persist. The SuperTrend component captures this momentum while the range filters prevent premature entries during pullbacks.
Smart Money Theory
The SMC elements are based on the concept that institutional traders (banks, hedge funds) leave footprints in the form of:
Order Blocks: Areas where large orders were placed
Fair Value Gaps: Inefficient price movements that may be revisited
Liquidity Sweeps: Stop hunts before continuation (EQH/EQL)
Volatility-Based Position Sizing
Using ATR for stop-loss placement ensures that stop distances adapt to current market conditions:
Tight stops in low volatility (avoids excessive risk)
Wider stops in high volatility (avoids premature stop-outs)
PERFORMANCE EXPECTATIONS
Realistic Expectations
Win Rate:
Expected: 45-55% (trend-following systems rarely exceed 60%)
Higher win rates on trending days
Lower win rates during consolidation (even with ADX filter)
Risk-Reward Ratio:
Target: 1.5:1 minimum (TP2)
Achievable: 2:1 to 3:1 on strong trends
Drawdowns:
Normal: 10-15% of account during choppy periods
Maximum: Should not exceed 20% with proper risk management
Optimization Tips
Backtesting Recommendations:
Test on at least 1 year of historical data
Include different market conditions (trending, ranging, volatile)
Adjust SuperTrend sensitivity per instrument
Optimize ADX threshold for your specific market
Record trades to identify personal execution errors
FREQUENTLY ASKED QUESTIONS
Q: Can I use this for automated trading?
A: The indicator provides signals, but you'll need to code a strategy script separately for automation. The signals can trigger alerts that connect to trading bots.
Q: Why do I see conflicting signals?
A: This is normal during transition periods. Wait for all confirmation layers to align before entering.
Q: How often should I expect signals?
A: Depends on timeframe and market conditions. On 5m charts during trending markets: 3-7 quality setups per session.
Q: Can I use only some features?
A: Yes, all components can be toggled on/off. However, the system works best with all confirmations active.
Q: What's the difference between internal and swing structures?
A: Internal = minor price structures (smaller pivots). Swing = major price structures (larger pivots). Both provide different levels of confirmation.
DISCLAIMER
This indicator is a tool for technical analysis and should not be the sole basis for trading decisions. Past performance does not guarantee future results. Always:
Use proper risk management
Test on demo accounts first
Never risk more than you can afford to lose
Combine with fundamental analysis when applicable
Understand that no indicator is 100% accurate
License: Mozilla Public License 2.0
Author: DrFXGOD
VERSION HISTORY & UPDATES
Initial Release - Version 1.0
Integrated SuperTrend, Range Filters, ADX, SMC concepts
ATR-based risk management
Multi-timeframe support
Customizable visual elements
SUPPORT & DOCUMENTATION
For questions, suggestions, or bug reports, please comment on the script page or contact the author through TradingView.
Additional Resources:
Smart Money Concepts: Research ICT (Inner Circle Trader) materials
ATR and Volatility: Refer to Wilder's original ATR documentation
SuperTrend Indicator: Study original SuperTrend strategy papers
Scalper Pro is a comprehensive multi-timeframe trading indicator that combines Smart Money Concepts (SMC) with traditional technical analysis to provide scalpers and day traders with high-probability entry and exit signals. This indicator integrates multiple analytical frameworks into a unified visual system designed specifically for short-term trading strategies.
ORIGINALITY & PURPOSE
What Makes This Script Original
This script is not a simple mashup of existing indicators. Instead, it represents a carefully orchestrated integration of complementary analytical methods that work together to solve a specific problem: identifying high-probability scalping opportunities in volatile markets.
The unique value proposition:
Adaptive Trend Filtering System - Combines a customized SuperTrend algorithm with dual-period range filters (Cirrus Cloud) and Hull Moving Average trend cloud to create a three-layer trend confirmation system
Smart Money Concepts Integration - Incorporates institutional trading concepts (Order Blocks, Fair Value Gaps, Break of Structure) with retail technical indicators for a complete market structure view
Dynamic Risk Management - Automatically calculates stop-loss and take-profit levels based on ATR volatility, providing objective position sizing
ADX-Based Market Regime Detection - Identifies ranging vs. trending markets through ADX analysis with visual bar coloring to prevent whipsaws during consolidation
Why Combine These Specific Components
Each component addresses a specific weakness in scalping:
SuperTrend provides the primary directional bias but can generate false signals in ranging markets
Range Filters smooth out noise and confirm trend direction, reducing SuperTrend false positives
ADX Analysis prevents trading during low-volatility consolidation when most indicators fail
SMC Elements identify institutional activity zones where price is likely to react strongly
ATR-Based Risk Management adapts position sizing to current volatility conditions
The synergy creates a system where signals are only generated when multiple confirmation layers align, significantly reducing false signals common in single-indicator approaches.
HOW IT WORKS
Core Calculation Methodology
1. SuperTrend Signal Generation
The script uses a modified SuperTrend algorithm with the following calculation:
ATR = Average True Range (default: 10 periods)
Factor = 7 (default sensitivity multiplier)
Upper Band = Source + (Factor × ATR)
Lower Band = Source - (Factor × ATR)
Directional Logic:
When price crosses above SuperTrend → Bullish signal
When price crosses below SuperTrend → Bearish signal
SuperTrend value is plotted as dynamic support/resistance
Key Modification: The sensitivity parameter (nsensitivity * 7) allows users to adjust the aggressiveness of trend detection without changing the core ATR calculation.
2. Range Filter System (Cirrus Cloud)
The Range Filter uses a smoothed range calculation to filter out market noise:
Smooth Range Calculation:
WPER = (Period × 2) - 1
AVRNG = EMA(|Price - Price[1]|, Period)
Smooth Range = EMA(AVRNG, WPER) × Multiplier
Two-Layer System:
Layer 1: 22-period with 6x multiplier (broader trend)
Layer 2: 15-period with 5x multiplier (tighter price action)
Visual Output: The space between these two filters is colored:
Green fill = Bullish trend (Layer 1 > Layer 2)
Red fill = Bearish trend (Layer 1 < Layer 2)
This creates a "cloud" that expands during strong trends and contracts during consolidation.
3. ADX Market Regime Detection
Calculation:
+DM = Positive Directional Movement
-DM = Negative Directional Movement
True Range = RMA of True Range (15 periods)
+DI = 100 × RMA(+DM, 15) / True Range
-DI = 100 × RMA(-DM, 15) / True Range
ADX = 100 × RMA(|+DI - -DI| / (+DI + -DI), 15)
Threshold System:
ADX < Threshold (default 15) = Ranging market → Bar color changes to purple
ADX > Threshold = Trending market → Normal bar coloring applies
Purpose: This prevents taking trend-following signals during sideways markets where most indicators produce whipsaws.
4. Smart Money Concepts (SMC) Integration
Order Blocks (OB):
Identified using swing high/low detection with customizable pivot length
Bullish OB: Last down-close candle before bullish Break of Structure (BOS)
Bearish OB: Last up-close candle before bearish BOS
Extended forward until price breaks through them
Fair Value Gaps (FVG):
Detected when a three-candle gap exists:
Bullish FVG: Low[0] > High[2]
Bearish FVG: High[0] < Low[2]
Filtered by price delta percentage to ensure significant gaps
Displayed as boxes that delete when price fills the gap
Break of Structure (BOS) vs. Change of Character (CHoCH):
BOS = Price breaks the previous structural high/low in the current trend direction
CHoCH = Price breaks structure in the opposite direction (potential trend reversal)
Both internal (minor) and swing (major) structures are tracked
Equal Highs/Lows (EQH/EQL):
Detected when consecutive swing highs/lows are within ATR threshold
Often indicates liquidity pools that price may sweep before reversing
5. ATR-Based Risk Management
Calculation:
ATR Band = ATR(14) × Risk Multiplier (default 3%)
Stop Loss = Entry - ATR Band (for longs) or Entry + ATR Band (for shorts)
Take Profit Levels:
TP1 = Entry + (Entry - Stop Loss) × 1
TP2 = Entry + (Entry - Stop Loss) × 2
TP3 = Entry + (Entry - Stop Loss) × 3
Dynamic Labels: Stop loss and take profit levels are automatically calculated and displayed as labels on the chart when new signals trigger.
6. Hull Moving Average Trend Cloud
HMA = WMA(2 × WMA(Close, Period/2) - WMA(Close, Period), sqrt(Period))
Period = 600 bars (long-term trend)
The HMA provides a smoothed long-term trend reference that's more responsive than traditional moving averages while filtering out short-term noise.
HOW TO USE THE INDICATOR
Entry Signals
Primary Buy Signal:
SuperTrend changes to green (price crosses above)
ADX shows market is NOT ranging (bars are NOT purple)
Price is within or near a bullish Order Block OR bullish FVG
Cirrus Cloud shows green fill (Layer 1 > Layer 2)
Primary Sell Signal:
SuperTrend changes to red (price crosses below)
ADX shows market is NOT ranging
Price is within or near a bearish Order Block OR bearish FVG
Cirrus Cloud shows red fill (Layer 1 < Layer 2)
Confirmation Layers
Higher Probability Trades Include:
Bullish/Bearish BOS in the same direction as signal
Equal highs/lows being swept before entry
Price respecting premium/discount zones (above/below equilibrium)
Multiple timeframe alignment (use MTF settings)
Exit Strategy
The indicator provides three take-profit levels:
TP1: Conservative target (1:1 risk-reward)
TP2: Moderate target (2:1 risk-reward)
TP3: Aggressive target (3:1 risk-reward)
Suggested Exit Approach:
Close 1/3 position at TP1
Move stop to breakeven
Close 1/3 position at TP2
Trail remaining position or exit at TP3
Risk Management
Stop Loss:
Use the ATR-based stop loss level displayed on chart
Alternatively, use percentage-based stop (adjustable in settings)
Never risk more than 1-2% of account per trade
Position Sizing:
Position Size = (Account Risk $) / (Entry Price - Stop Loss Price)
CUSTOMIZABLE SETTINGS
Core Parameters
Buy/Sell Signals:
Toggle signals on/off
Adjust SuperTrend sensitivity (0.5 - 2.0)
Risk Management:
Show/hide TP/SL levels
ATR period (default: 14)
Risk percentage (default: 3%)
Number of decimal places for price labels
Trend Features:
Cirrus Cloud display toggle
Range filter periods (x1, x2, x3, x4)
Hull MA length for trend cloud
Smart Money Concepts:
Order Block settings (swing length, display count)
Fair Value Gap parameters (auto-threshold, extend length)
Structure detection (internal vs swing)
EQH/EQL threshold
ADX Settings:
ADX length (default: 15)
Sideways threshold (10-30, default: 15)
Bar color toggle
Display Options:
Previous day/week/month high/low levels
Premium/Discount/Equilibrium zones
Trend candle coloring (colored or monochrome)
BEST PRACTICES & TRADING TIPS
Optimal Use Cases
Scalping on lower timeframes (1m, 5m, 15m)
Rapid entry/exit with clear TP levels
ADX filter prevents choppy market entries
Day trading on medium timeframes (30m, 1H)
Stronger trend confirmation
Better risk-reward ratios
Swing trading entries on higher timeframes (4H, Daily)
Higher-probability structural setups
Larger ATR-based stops accommodate volatility
Market Conditions
Best Performance:
Trending markets with clear directional bias
Post-news volatility with defined structure
Markets respecting support/resistance levels
Avoid Trading When:
ADX indicator shows purple bars (ranging market)
Multiple conflicting signals across timeframes
Major news events without clear price structure
Low volume periods (market open/close)
Common Mistakes to Avoid
Ignoring the ADX filter - Taking signals during ranging markets leads to whipsaws
Not waiting for confirmation - Enter only when multiple layers align
Overtrading - Fewer high-quality setups outperform many mediocre ones
Ignoring risk management - Always use the calculated stop losses
Fighting the trend - Trade WITH the SuperTrend and Cirrus Cloud direction
TECHNICAL SPECIFICATIONS
Indicator Type: Overlay (plots on price chart)
Calculation Resources:
Max labels: 500
Max lines: 500
Max boxes: 500
Max bars back: 500
Pine Script Version: 5
Compatible Timeframes: All timeframes (optimized for 1m to 1D)
Compatible Instruments:
Forex pairs
Crypto assets
Stock indices
Individual stocks
Commodities
THEORETICAL FOUNDATION
Trend-Following Concepts
This indicator is based on the principle that markets trend more often than they range, and that trends tend to persist. The SuperTrend component captures this momentum while the range filters prevent premature entries during pullbacks.
Smart Money Theory
The SMC elements are based on the concept that institutional traders (banks, hedge funds) leave footprints in the form of:
Order Blocks: Areas where large orders were placed
Fair Value Gaps: Inefficient price movements that may be revisited
Liquidity Sweeps: Stop hunts before continuation (EQH/EQL)
Volatility-Based Position Sizing
Using ATR for stop-loss placement ensures that stop distances adapt to current market conditions:
Tight stops in low volatility (avoids excessive risk)
Wider stops in high volatility (avoids premature stop-outs)
PERFORMANCE EXPECTATIONS
Realistic Expectations
Win Rate:
Expected: 45-55% (trend-following systems rarely exceed 60%)
Higher win rates on trending days
Lower win rates during consolidation (even with ADX filter)
Risk-Reward Ratio:
Target: 1.5:1 minimum (TP2)
Achievable: 2:1 to 3:1 on strong trends
Drawdowns:
Normal: 10-15% of account during choppy periods
Maximum: Should not exceed 20% with proper risk management
Optimization Tips
Backtesting Recommendations:
Test on at least 1 year of historical data
Include different market conditions (trending, ranging, volatile)
Adjust SuperTrend sensitivity per instrument
Optimize ADX threshold for your specific market
Record trades to identify personal execution errors
FREQUENTLY ASKED QUESTIONS
Q: Can I use this for automated trading?
A: The indicator provides signals, but you'll need to code a strategy script separately for automation. The signals can trigger alerts that connect to trading bots.
Q: Why do I see conflicting signals?
A: This is normal during transition periods. Wait for all confirmation layers to align before entering.
Q: How often should I expect signals?
A: Depends on timeframe and market conditions. On 5m charts during trending markets: 3-7 quality setups per session.
Q: Can I use only some features?
A: Yes, all components can be toggled on/off. However, the system works best with all confirmations active.
Q: What's the difference between internal and swing structures?
A: Internal = minor price structures (smaller pivots). Swing = major price structures (larger pivots). Both provide different levels of confirmation.
DISCLAIMER
This indicator is a tool for technical analysis and should not be the sole basis for trading decisions. Past performance does not guarantee future results. Always:
Use proper risk management
Test on demo accounts first
Never risk more than you can afford to lose
Combine with fundamental analysis when applicable
Understand that no indicator is 100% accurate
License: Mozilla Public License 2.0
Author: DrFXGOD
VERSION HISTORY & UPDATES
Initial Release - Version 1.0
Integrated SuperTrend, Range Filters, ADX, SMC concepts
ATR-based risk management
Multi-timeframe support
Customizable visual elements
SUPPORT & DOCUMENTATION
For questions, suggestions, or bug reports, please comment on the script page or contact the author through TradingView.
Additional Resources:
Smart Money Concepts: Research ICT (Inner Circle Trader) materials
ATR and Volatility: Refer to Wilder's original ATR documentation
SuperTrend Indicator: Study original SuperTrend strategy papers
开源脚本
本着TradingView的真正精神,此脚本的创建者将其开源,以便交易者可以查看和验证其功能。向作者致敬!虽然您可以免费使用它,但请记住,重新发布代码必须遵守我们的网站规则。
免责声明
这些信息和出版物并不意味着也不构成TradingView提供或认可的金融、投资、交易或其它类型的建议或背书。请在使用条款阅读更多信息。
开源脚本
本着TradingView的真正精神,此脚本的创建者将其开源,以便交易者可以查看和验证其功能。向作者致敬!虽然您可以免费使用它,但请记住,重新发布代码必须遵守我们的网站规则。
免责声明
这些信息和出版物并不意味着也不构成TradingView提供或认可的金融、投资、交易或其它类型的建议或背书。请在使用条款阅读更多信息。