OPEN-SOURCE SCRIPT
[Mycryptoradar] Triple EMA Strategie
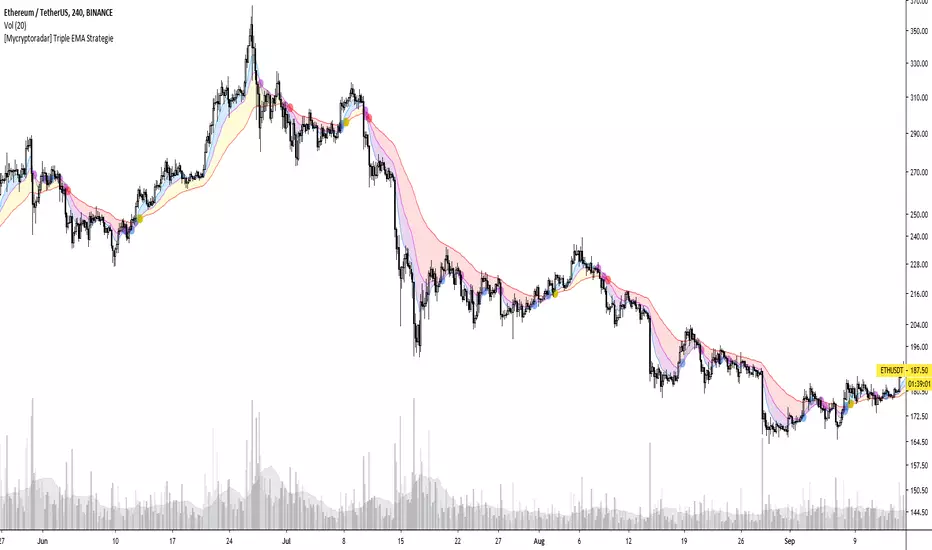
Triple EMA strategy consists of EMA 9, 21 & 55. A widely discussed trading strategy. If you want to know more about this strategy, enter the following search term at Google, "triple EMA 9, 21, 55 strategy".
How does this indicator work!
Background blue / yellow = bullish
Background red / purple = bearish
Every EMA crossover can be displayed on the chart (see circles)
Blue / blue / yellow circles = bullish
Purple / purple / red circles = bearish
Play with the settings and adjust them to your hand and don't forget to read about the EMA 9, 21, 55 strategy. Each background and crossover marking can be switched on and off separately.
This indicator visualizes the strategy and is not financial advice, you trade on your own findings. Has the indicator helped you with trading? Then leave a comment and like the indicator.
WANNA TIP ME? BUY ME SOME BEERS!
BTC: 3BMEXX5JrX94ziUSoQMLEmi51WcYwphAg3
ETH: 0x541e504bb461aa141de6ddce09dc89eb16f58f9c
LTC: LPBJXzUZJksCuCK27AY2qAVYGGGiUfejok
DON'T FORGET TO LOOK AT OUR SITE MYCRYPTORADAR
开源脚本
秉承TradingView的精神,该脚本的作者将其开源,以便交易者可以查看和验证其功能。向作者致敬!您可以免费使用该脚本,但请记住,重新发布代码须遵守我们的网站规则。
免责声明
这些信息和出版物并非旨在提供,也不构成TradingView提供或认可的任何形式的财务、投资、交易或其他类型的建议或推荐。请阅读使用条款了解更多信息。
开源脚本
秉承TradingView的精神,该脚本的作者将其开源,以便交易者可以查看和验证其功能。向作者致敬!您可以免费使用该脚本,但请记住,重新发布代码须遵守我们的网站规则。
免责声明
这些信息和出版物并非旨在提供,也不构成TradingView提供或认可的任何形式的财务、投资、交易或其他类型的建议或推荐。请阅读使用条款了解更多信息。