OPEN-SOURCE SCRIPT
Expected SPX Movement by timeframe

THIS INDICATOR ONLY WORKS FOR  SPXCHART
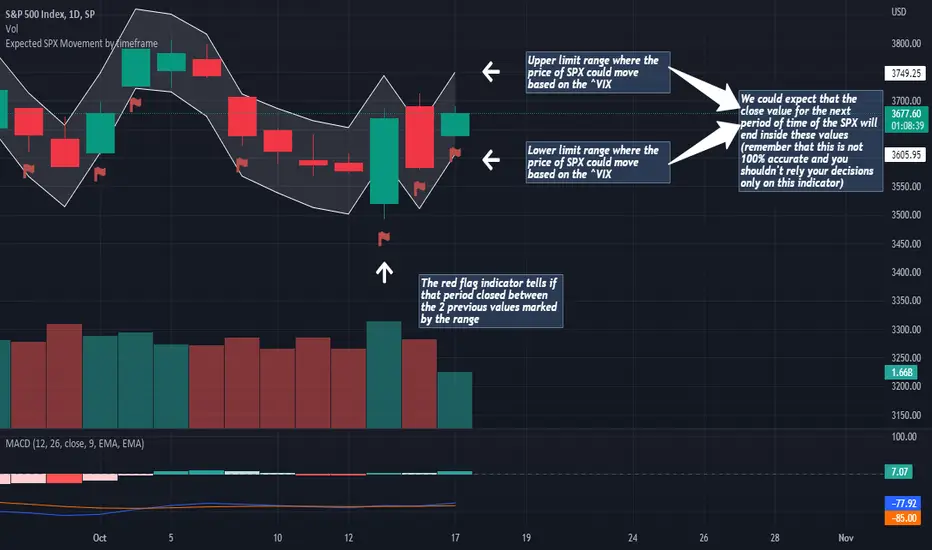
This code will help you to measure the expected movement of SPXin a previously selected timeframe based on the current value of VIX index
E.g. if the current value of VIX is 30 we calculate first the expected move of the next 12 months.
Once you have that calculation it it'll provide the range expressed as percentage of the expected move for the following period.
This script will plot that information in a range of 2 lines which represents the expected move of the SPX for the next period
The red flag indicator tells if that period closed between the 2 previous values marked by the range
This code will help you to measure the expected movement of
E.g. if the current value of VIX is 30 we calculate first the expected move of the next 12 months.
- If you selected the Daily timeframe it will calculate the expected move of SPX in the next Day by dividing the current VIX Value by the squared root of 252
(The 252 value corresponds to the approximate amount of trading sessions of the year)
If you selected the Weekly timeframe it will calculate the expected move of SPX in the next Week by dividing the current VIX Value by the squared root of 52
(The 52 value corresponds to the amount of weeks of the year)
If you selected the Monthly timeframe it will calculate the expected move of SPX in the next Week by dividing the current VIX Value by the squared root of 12
(The 12 value corresponds to the amount of months of the year)
For lower timeframes you have to calculate the amount of ticks in each trading session of the year in order to get that specific range
Once you have that calculation it it'll provide the range expressed as percentage of the expected move for the following period.
This script will plot that information in a range of 2 lines which represents the expected move of the SPX for the next period
The red flag indicator tells if that period closed between the 2 previous values marked by the range
开源脚本
秉承TradingView的精神,该脚本的作者将其开源,以便交易者可以查看和验证其功能。向作者致敬!您可以免费使用该脚本,但请记住,重新发布代码须遵守我们的网站规则。
免责声明
这些信息和出版物并非旨在提供,也不构成TradingView提供或认可的任何形式的财务、投资、交易或其他类型的建议或推荐。请阅读使用条款了解更多信息。
开源脚本
秉承TradingView的精神,该脚本的作者将其开源,以便交易者可以查看和验证其功能。向作者致敬!您可以免费使用该脚本,但请记住,重新发布代码须遵守我们的网站规则。
免责声明
这些信息和出版物并非旨在提供,也不构成TradingView提供或认可的任何形式的财务、投资、交易或其他类型的建议或推荐。请阅读使用条款了解更多信息。