OPEN-SOURCE SCRIPT
ATR% Multiple From MA - Overextensions tracking
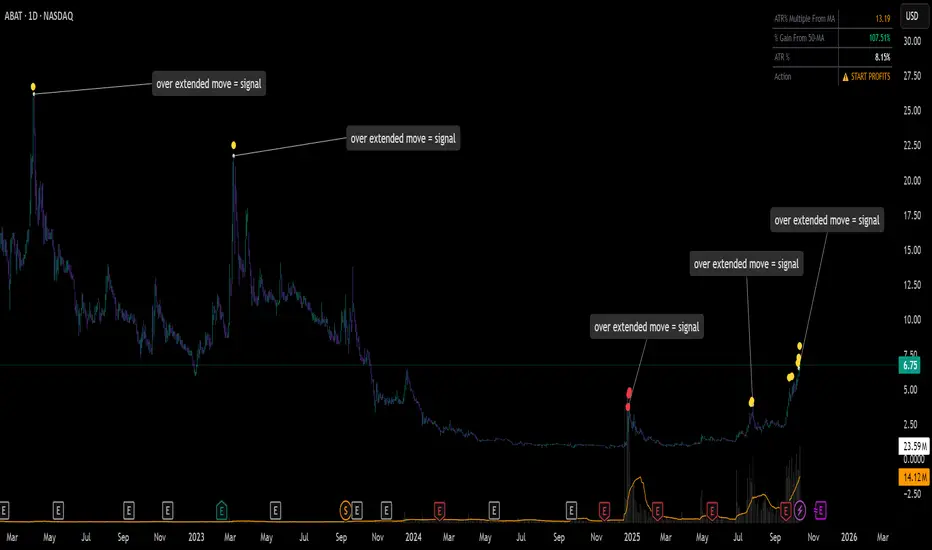
ATR% Multiple From MA - Quantifiable Profit Taking Indicator
This overlay indicator identifies overextended price moves by calculating how many ATR% multiples price is away from a moving average, providing objective profit-taking signals.
Formula:
A = ATR% = (ATR / Price) × 100
B = % Gain from MA = ((Price - MA) / MA) × 100
ATR% Multiple = B / A
Signals:
Yellow circle at 7x: Start scaling out partial profits
Red circle at 10x+: Heavily overextended, aggressive profit taking recommended
Stats table: Real-time ATR% Multiple, % Gain from MA, ATR%, and action status
For very volatile markets I usually go for 10x and 15x extension instead of 7x and 10x.
This method normalizes moves across different volatility environments, eliminating emotional decision-making. Historical examples include PLTR, SOFI, TSLA, NVDA which stalled after exceeding 10x.
Customizable Settings:
ATR Length (default: 14)
MA Length (default: 50)
Profit Zone thresholds (7x, 10x)
Toggle circles and MA display
开源脚本
秉承TradingView的精神,该脚本的作者将其开源,以便交易者可以查看和验证其功能。向作者致敬!您可以免费使用该脚本,但请记住,重新发布代码须遵守我们的网站规则。
免责声明
这些信息和出版物并非旨在提供,也不构成TradingView提供或认可的任何形式的财务、投资、交易或其他类型的建议或推荐。请阅读使用条款了解更多信息。
免责声明
这些信息和出版物并非旨在提供,也不构成TradingView提供或认可的任何形式的财务、投资、交易或其他类型的建议或推荐。请阅读使用条款了解更多信息。