INVITE-ONLY SCRIPT
Hawkeye Fatboy
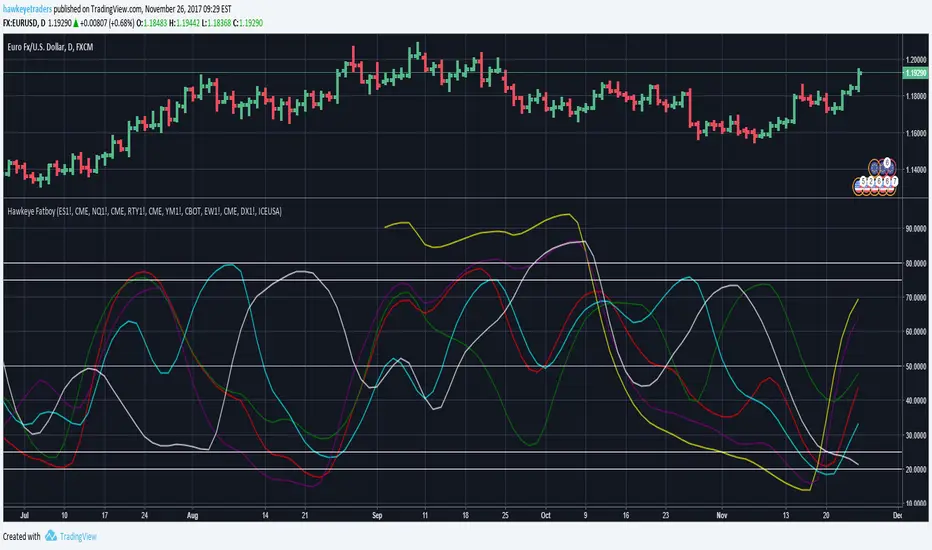
Fatboy is a powerful and extremely flexible indicator, and like Fatman, it instantly reveals which markets are overbought, and which are oversold. But it also reveals which markets are correlating and which are not, giving a valuable insight into the overall market in one simple picture.
The Fatboy can be configured to work with stocks and ETFs, and is very effective in identifying candidates for pairs trading.
Simply enter the index of a group of stocks, for example, Healthcare, and then place the top nine Health stocks in which you're interested in trading and it will show you those which are trading in harmony with the index or those against the Healthcare index. Obviously, you should always trade in harmony with the index.
When the markets are in a strong trend, the Fatboy lines ALL come together in unison. The stronger the price action, the tighter the lines are, appearing almost as a single line on the indicator. So when related markets are trending together strongly, you know it's a low risk trading opportunity – without having to study several different charts or timeframes. It's all presented on one simple screen.
However it is not limited to correlation. The Fatboy can identify divergence in markets and equities, identifying pairs trading at its best. Using inversely related instruments, the Fatboy will identify strengths and weakness in currencies versus futures, and so on. You can even use the Fatboy to identify sector strength or weakness.
仅限邀请脚本
仅限作者授权的用户访问此脚本,并且通常需要付费。您可以将其添加到收藏中,但是只有在向作者请求并获得许可之后,才能使用它。 请联系hawkeyetraders了解更多信息,或按照以下作者的说明操作。
TradingView不建议付费使用脚本,除非您100%信任作者并了解脚本的工作原理。在许多情况下,您可以在我们的社区脚本免费找到不错的开源替代方案。
作者的说明
″
想在图表上使用此脚本?
警告:请在申请访问权限之前阅读。
Randy Lindsey
Hawkeye Traders, LLC
Hawkeye Traders, LLC
免责声明
这些信息和出版物并不意味着也不构成TradingView提供或认可的金融、投资、交易或其它类型的建议或背书。请在使用条款阅读更多信息。