OPEN-SOURCE SCRIPT
EMA (20, 50, 100, 200) incl. TIMEFRAME!
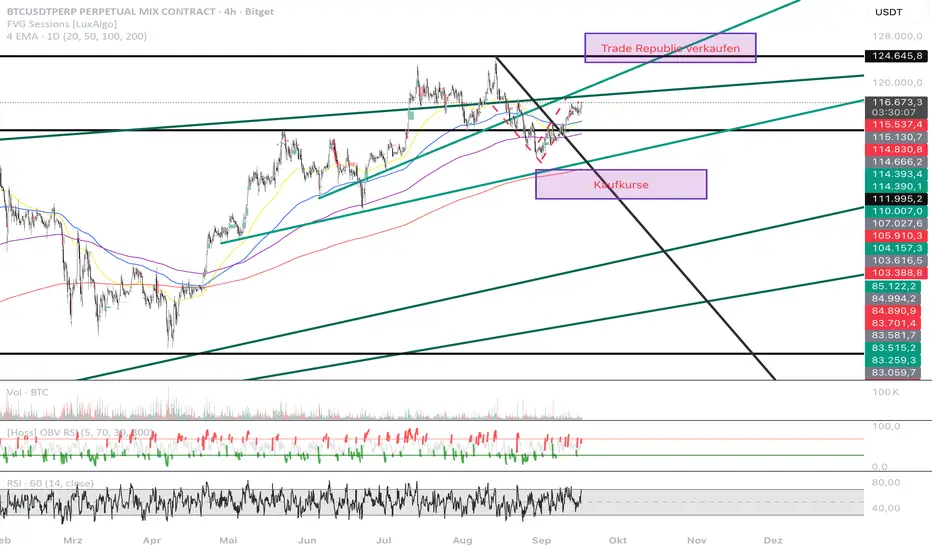
Multi-Timeframe EMA Indicator
Indicator designed for TradingView that plots up to four distinct Exponential Moving Average (EMA) lines on your chart. The script is highly flexible, allowing you to configure each EMA's length and color individually. Additionally, it features a crucial timeframe parameter, which enables you to apply the EMAs from a different, higher timeframe directly to your current chart.
Key Features:
Four Independent EMAs: The indicator calculates and displays four separate EMA lines simultaneously. The default lengths are set to the popular values of 20, 50, 100, and 200, which are commonly used for short-term, medium-term, and long-term trend analysis.
Customizable Length and Color: You have full control over each EMA. In the indicator's settings, you can easily change the length of each moving average to suit your trading strategy. You can also customize the color of each line, making it easy to distinguish them on the chart.
Multi-Timeframe Analysis (MTF): The most powerful feature is the timeframe parameter. By entering a different timeframe (e.g., "D" for daily, "W" for weekly, or "60" for hourly), the indicator will calculate the EMAs based on that specific timeframe's data, regardless of your chart's current resolution. This is invaluable for traders who want to see long-term trends on a short-term chart without having to switch timeframes.
开源脚本
本着TradingView的真正精神,此脚本的创建者将其开源,以便交易者可以查看和验证其功能。向作者致敬!虽然您可以免费使用它,但请记住,重新发布代码必须遵守我们的网站规则。
免责声明
这些信息和出版物并不意味着也不构成TradingView提供或认可的金融、投资、交易或其它类型的建议或背书。请在使用条款阅读更多信息。
免责声明
这些信息和出版物并不意味着也不构成TradingView提供或认可的金融、投资、交易或其它类型的建议或背书。请在使用条款阅读更多信息。