OPEN-SOURCE SCRIPT
已更新 Day Week Month High & Low
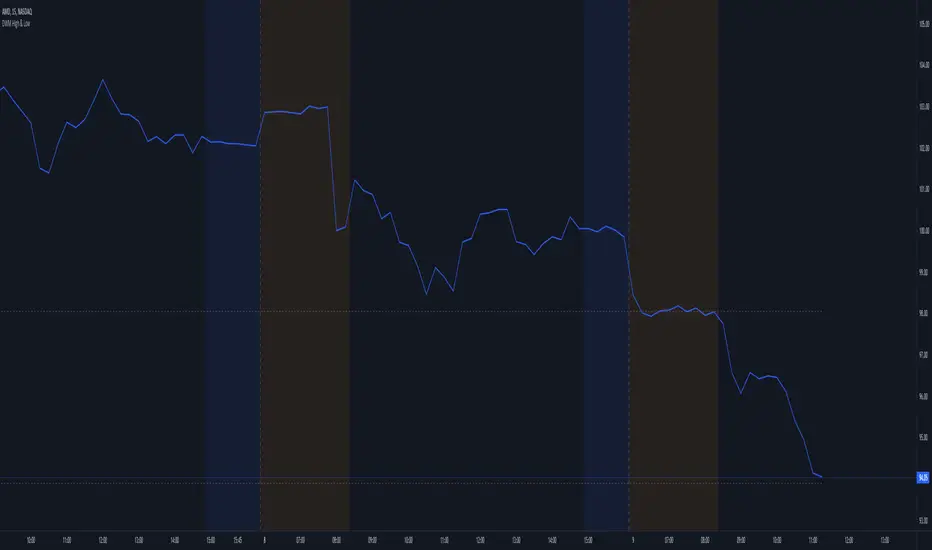
This is a small little script that helps visually mark the high and lows of the DAY, WEEK or MONTH (of your choosing). It's best when paired with my High and Low Fibonacci Pivot Points indicator to help emphasize the high and lows of the day, week or month.
版本注释
Added a 2-Day high and low setting. This was added as an inquiry about a modification for a 2-Day high and low.版本注释
Added some additional visual updates. I wasn't planning on releasing any additional updates, since I keep getting hit with infractions for my scripts being deemed as not original (although it's 100% my own work), nor not colorful/exciting to look at. Since, I've been receiving kind feedbacks from a user or two, I've released this update to the public.Updates Include:
- Allowing you to choose the line style (dashed, dotted or solid)
- Added an additional 1-Hour timeframe selection (for those who like to scalp with tight entries & stops)
- For those who set the timeframe to DAY, can choose to enable the lines to alternate to a different color, when the DAY high matches the WEEK high and the same is applied when the DAY low matches the WEEK low. This could be useful for those who swing trade on a weekly basis (i.e. open & close trades within the same week).
开源脚本
秉承TradingView的精神,该脚本的作者将其开源,以便交易者可以查看和验证其功能。向作者致敬!您可以免费使用该脚本,但请记住,重新发布代码须遵守我们的网站规则。
免责声明
这些信息和出版物并非旨在提供,也不构成TradingView提供或认可的任何形式的财务、投资、交易或其他类型的建议或推荐。请阅读使用条款了解更多信息。
开源脚本
秉承TradingView的精神,该脚本的作者将其开源,以便交易者可以查看和验证其功能。向作者致敬!您可以免费使用该脚本,但请记住,重新发布代码须遵守我们的网站规则。
免责声明
这些信息和出版物并非旨在提供,也不构成TradingView提供或认可的任何形式的财务、投资、交易或其他类型的建议或推荐。请阅读使用条款了解更多信息。