OPEN-SOURCE SCRIPT
Horizontal Lines at Custom Intervals
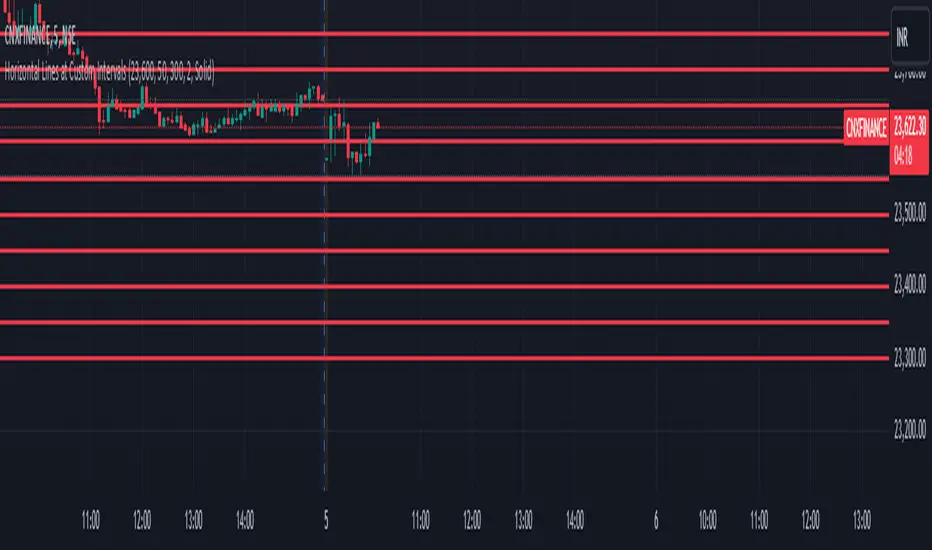
This Pine Script indicator, "Horizontal Lines at Custom Intervals," is a versatile tool designed to help traders visualize key price levels at regular intervals above and below a specified starting price. It is particularly useful for identifying support and resistance zones, psychological price levels, or potential entry and exit points around a central price reference.
Customizable Starting Price**: Set a central price around which the lines will be drawn, such as a current asset price, pivot level, or significant historical level.
- **Adjustable Intervals and Range**: Choose the interval distance (in points) between each horizontal line, as well as the total range above and below the starting price. This flexibility allows the indicator to adapt to different asset classes and timeframes.
- **Full Chart Extensions**: Each line is set to extend across the entire chart, providing a clear, continuous visual reference that spans both past and future price action.
- **Editable Line Style, Width, and Color**: Personalize the appearance of the lines with selectable color, width, and style options (Solid, Dotted, Dashed), enabling the indicator to match your charting preferences and visual style.
### Applications:
1. **Support and Resistance Identification**: Traders can use the evenly spaced lines to identify potential support and resistance zones around the starting price, helping to mark areas of interest where price may react.
2. **Psychological Levels**: Round-number levels often hold psychological significance in trading. By setting intervals to common round numbers, this indicator can help identify these critical levels.
3. **Scalping and Range Trading**: This tool is especially valuable in range-bound markets, where repeated price action within defined levels allows traders to buy and sell around predictable zones.
4. **Trend Reversal and Breakout Signals**: In trending markets, observing how price interacts with these levels can offer insights into possible breakouts or trend reversals.
### Example Use Case:
For instance, if BankNifty is trading around 51,130, you can set this as the starting price. With 50-point intervals and a range of 1,000 points, the indicator will plot lines at 50-point increments both above and below 51,130, covering a total range of 2,000 points. This setup provides clear visual cues for potential price reaction zones as the asset moves through different price levels.
This indicator is a simple yet powerful addition to any trader’s toolkit, offering a structured approach to analyzing price levels and making informed trading decisions.
开源脚本
秉承TradingView的精神,该脚本的作者将其开源,以便交易者可以查看和验证其功能。向作者致敬!您可以免费使用该脚本,但请记住,重新发布代码须遵守我们的网站规则。
免责声明
这些信息和出版物并非旨在提供,也不构成TradingView提供或认可的任何形式的财务、投资、交易或其他类型的建议或推荐。请阅读使用条款了解更多信息。
开源脚本
秉承TradingView的精神,该脚本的作者将其开源,以便交易者可以查看和验证其功能。向作者致敬!您可以免费使用该脚本,但请记住,重新发布代码须遵守我们的网站规则。
免责声明
这些信息和出版物并非旨在提供,也不构成TradingView提供或认可的任何形式的财务、投资、交易或其他类型的建议或推荐。请阅读使用条款了解更多信息。