OPEN-SOURCE SCRIPT
已更新 [ BETA ][ IND ][ LIB ] Dynamic LookBack RSI Range

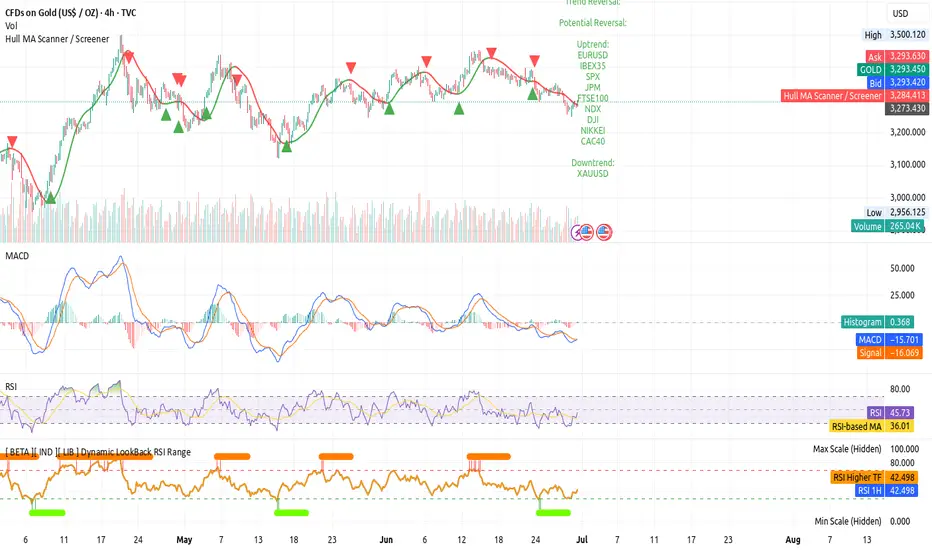
Get visual confirmation with this indicator if the current range selected had been oversold or overbough in the latest n bars
版本注释
Dynamic LookBack RSI Range is an indicator designed for multi-timeframe Relative Strength Index (RSI) analysis.It computes and displays RSI values from both the current chart's timeframe and a user-definable higher timeframe that helps to detect historical RSI extreme conditions within a specified lookback window on the higher timeframe.
Key Features:
Dual RSI Calculation & Plotting:
Calculates and plots the RSI (Relative Strength Index) for the current chart's timeframe based on close price and a user-defined rsiLength (default 14).
Calculates and plots the RSI for a Higher Timeframe (HTF), specified by the higherTimeframe input (options include "1", "5", "15", "30", "60", "120", "180", "240", "360", "480", "D"). This calculation is performed using request.security to ensure accurate HTF data.
Dynamic HTF Extreme Range Check:
Utilizes request.security in conjunction with math.sum to determine if the HTF RSI has been above the rsiOverbought level or below the rsiOversold level at any point within the rsiHTFLookbackBarsForRange number of bars on the selected higherTimeframe.
Boolean outputs wasHTFOverboughtInLookback and wasHTFOversoldInLookback are generated based on this lookback analysis.
Configurable Parameters:
rsiLength: Integer input for the RSI calculation period (default 14).
rsiOverbought: Integer input for the RSI overbought threshold (default 70).
rsiOversold: Integer input for the RSI oversold threshold (default 30).
higherTimeframe: String input for selecting the aggregation period for the HTF RSI.
rsiHTFLookbackBarsForRange: Integer input specifying the number of higher timeframe bars to check for past extreme RSI conditions (default 20).
Visual Representation:
Plots both current and HTF RSI lines on a dedicated pane.
Horizontal lines indicate the rsiOverbought and rsiOversold levels.
plotshape elements are used to visualize specific events:
Arrows (Down/Up): Indicate when the current HTF RSI crosses above rsiOverbought or below rsiOversold.
Circles (Top/Bottom): Mark bars where the HTF RSI was overbought or oversold within the rsiHTFLookbackBarsForRange period.
Alert Conditions:
Provides four distinct alert conditions for automated notifications:
HTF RSI crossing above rsiOverbought.
HTF RSI crossing below rsiOversold.
wasHTFOverboughtInLookback.
wasHTFOversoldInLookback.
开源脚本
秉承TradingView的精神,该脚本的作者将其开源,以便交易者可以查看和验证其功能。向作者致敬!您可以免费使用该脚本,但请记住,重新发布代码须遵守我们的网站规则。
免责声明
这些信息和出版物并非旨在提供,也不构成TradingView提供或认可的任何形式的财务、投资、交易或其他类型的建议或推荐。请阅读使用条款了解更多信息。
开源脚本
秉承TradingView的精神,该脚本的作者将其开源,以便交易者可以查看和验证其功能。向作者致敬!您可以免费使用该脚本,但请记住,重新发布代码须遵守我们的网站规则。
免责声明
这些信息和出版物并非旨在提供,也不构成TradingView提供或认可的任何形式的财务、投资、交易或其他类型的建议或推荐。请阅读使用条款了解更多信息。