PROTECTED SOURCE SCRIPT
BB vs KC Visual Zones
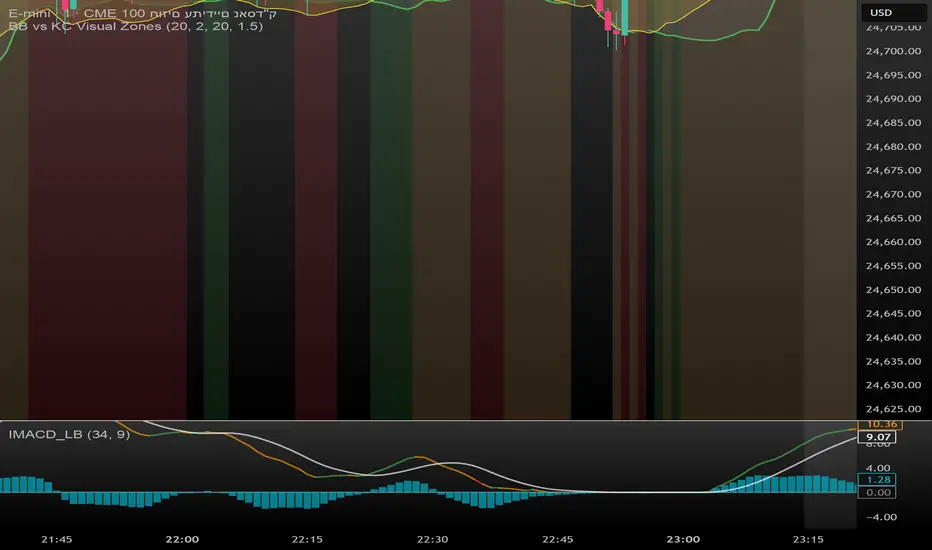
📌 BB vs KC Visual Zones
This script combines the power of two popular volatility indicators — Bollinger Bands (BB) and Keltner Channels (KC) — into one intuitive and visually enhanced tool. It is designed to help traders identify high-volatility moments in the market, often signaling potential breakouts.
✅ What’s Included:
Bollinger Bands based on SMA and standard deviation.
Keltner Channels based on EMA and ATR.
Color-coded highlights for quick visual analysis:
Upper BB in bold red when it crosses above the upper KC.
Lower BB in bold green when it drops below the lower KC.
Background color dynamically adjusts based on breakout conditions.
Clear visualization of Squeeze and Breakout scenarios directly on the main chart.
🎯 Best Used For:
Spotting potential breakout zones when BB expands beyond KC.
Understanding underlying market volatility conditions.
Using as a standalone volatility filter, or integrating into broader trading systems.
受保护脚本
此脚本以闭源形式发布。 但是,您可以自由使用,没有任何限制 — 了解更多信息这里。
NinjADeviL
免责声明
这些信息和出版物并非旨在提供,也不构成TradingView提供或认可的任何形式的财务、投资、交易或其他类型的建议或推荐。请阅读使用条款了解更多信息。
受保护脚本
此脚本以闭源形式发布。 但是,您可以自由使用,没有任何限制 — 了解更多信息这里。
NinjADeviL
免责声明
这些信息和出版物并非旨在提供,也不构成TradingView提供或认可的任何形式的财务、投资、交易或其他类型的建议或推荐。请阅读使用条款了解更多信息。