INVITE-ONLY SCRIPT
已更新 Cash The System Trend Indicator (STRATEGY)
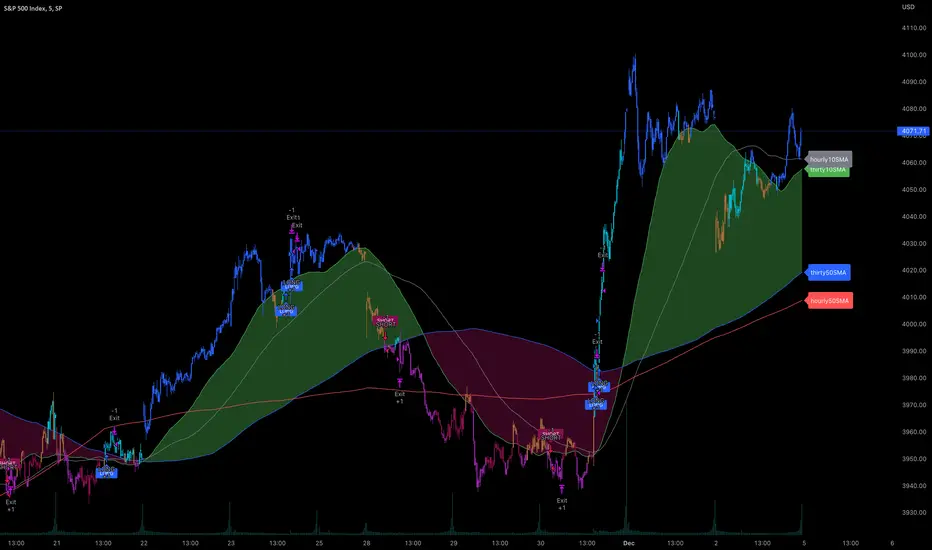
The System, created by @MasterBJones looks at the higher timeframe trend of SPX to determine Buy and Sell Signals.
If the 10SMA on the 30min chart is trading over the 50sma, then the market is bullish . If the 10SMA is trading under the 50SMA on the 30min chart, then the market is bearish .
This Indicator colors the candles based on what The System is currently telling us.
Blue = Strong Bullish - SPX/Ticker is trading above the 10 SMA and the 10 SMA > 50 SMA giving a BUY signal.
Aqua = Mild Bullish - SPX/Ticker is trading above the 50 SMA , but we do not have a BUY signal yet. MACD is bullish.
Amber = Uncertainty in the market. SPX/Ticker is in a chop zone, and trades in this area are high risk.
Pink = Mild Bearish - SPX/Ticker is trading below the 50 SMA , but we do not have a SELL signal yet. MACD is bearish.
Purple = Strong Bearish - SPX/Ticker is trading below the 10 SMA , and the 10 SMA < 50 SMA giving a SELL signal.
Along with the colored candlesticks , the indicator will signal when to go LONG or SHORT based on when the trend direction changes.
While The System was designed to be based on SPX , you can use this indicator to trade $ES_F futures , SPY options, SPX options, and other indexes.
Some users are also using the 10/50SMA to trade other tickers such as TSLA based on the same set of rules.
The official documentation for The System is based on SPX so be careful deviating from that ruleset and be sure to backtest before jumping in to trades with this.
Note - this indicator is experimental and your mileage may vary.
Please learn the system by following @MasterBJones on Twitter
版本注释
Updated the Chart Preview版本注释
tidied up some of the alert signal code to make it easier to manage. No change in the actual alert with this tweak.版本注释
Added the bands for the 100pt extended area on SPX版本注释
Added the ability to dynamically control the Profit/StopLoss logic when backtesting the strategy.版本注释
Fixed an issue where the bar colors for mild bullish and mild bearish were not quite right when price was moving back towards the 10sma (eg sell signal and trading under the 10/50sma but macd turning bullish)版本注释
- Added setting to enable/disable entry alerts
- Added setting to show OverBought/OverSold bands. Options are None, Bollinger Bands (2sd line), Bollinger Band Bands (shading for the BB Band between 1sd and 2sd lines), or the 100pt Extended line for SPX.
- Added tooltips to labels
- Added Bollinger Bands for OverBought/OverSold levels, similar to how the 100pt extended lines work for SPX in TheSystem. Learn more about BB here: getthatcashmoney.com/blog/how-to-trade-with-bollinger-bands/
版本注释
Tweaked the logic that was setting the mild bullish (light blue color) on the candles incorrectly.仅限邀请脚本
只有作者授权的用户才能访问此脚本。您需要申请并获得使用许可。通常情况下,付款后即可获得许可。更多详情,请按照下方作者的说明操作,或直接联系getthatcashmoney。
请注意,此私密、仅限邀请脚本未经脚本版主审核,是否符合网站规则尚未确定。 TradingView不建议您付费购买或使用任何脚本,除非您完全信任其作者并了解其工作原理。您也可以在我们的社区脚本找到免费的开源替代方案。
作者的说明
Get Access at http://www.getthatcashmoney.com
免责声明
这些信息和出版物并非旨在提供,也不构成TradingView提供或认可的任何形式的财务、投资、交易或其他类型的建议或推荐。请阅读使用条款了解更多信息。
仅限邀请脚本
只有作者授权的用户才能访问此脚本。您需要申请并获得使用许可。通常情况下,付款后即可获得许可。更多详情,请按照下方作者的说明操作,或直接联系getthatcashmoney。
请注意,此私密、仅限邀请脚本未经脚本版主审核,是否符合网站规则尚未确定。 TradingView不建议您付费购买或使用任何脚本,除非您完全信任其作者并了解其工作原理。您也可以在我们的社区脚本找到免费的开源替代方案。
作者的说明
Get Access at http://www.getthatcashmoney.com
免责声明
这些信息和出版物并非旨在提供,也不构成TradingView提供或认可的任何形式的财务、投资、交易或其他类型的建议或推荐。请阅读使用条款了解更多信息。