PROTECTED SOURCE SCRIPT
已更新 BANKNIFTY Free Float Volume
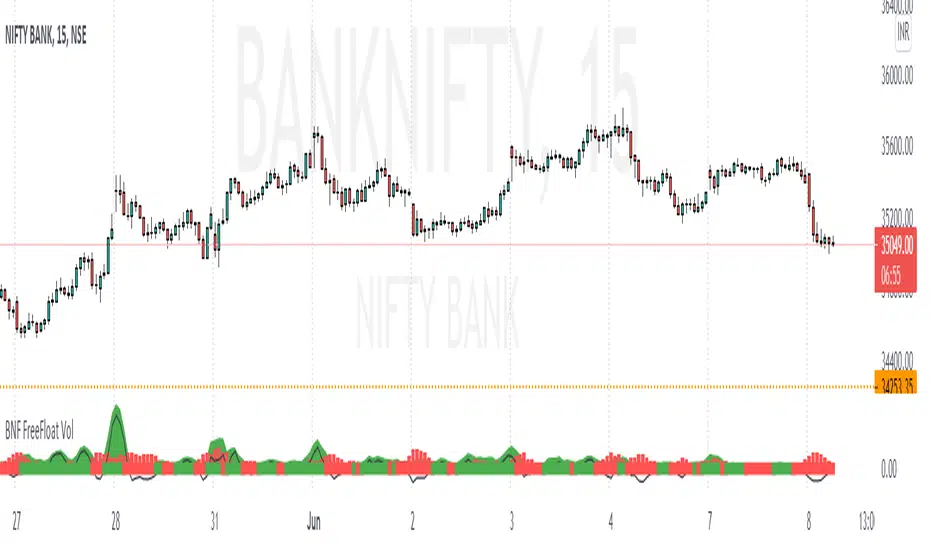
This indicator is build keeping in mind how the Indian Market is formed - free-float market capitalization concept
1) Considered all banknifty index stocks according to NSE
2) Multiplied each stock Volume by its Weightage given in NSE Site every month End - means giving importance to volume by its weightage
3) Green Candle - Considered as +Ve Volume , Red Candle - Considered as -Ve Volume
4) Diff of +Ve Volume & -Ve Volume give clear picture market will go up or down
Note:- This Indicator work only for 15 Min time frame
Gives better results good Risk Reward used near Supp/Resistance
Combine with BANKNIFTY / NIFTY Advance-Decline Ratio give confidence on the move
Eg:-
Bullish Scenario
Near Support, Volume Turned -Ve to +Ve, Adv /Dec of Nifty >30/35 or BNF Adv /Dec > 7
or combine any candle patterns( Pin Bar ) at Sup/Res or combine with Chart Pattern(Triangle/ Rectangle )
Can take 75 Pts as SL and target 150-200 Pts
Bearish Scenario - Vice Versa to above
backtested results showed high Accuracy when used in combination of Sup/Res
版本注释
1) Updated Weightages as per new index 2) Update chart type to do depth & detail analysis of Selling & Buying pressure to know bull / bear power at levels
受保护脚本
此脚本以闭源形式发布。 但是,您可以自由使用,没有任何限制 — 了解更多信息这里。
免责声明
这些信息和出版物并非旨在提供,也不构成TradingView提供或认可的任何形式的财务、投资、交易或其他类型的建议或推荐。请阅读使用条款了解更多信息。
受保护脚本
此脚本以闭源形式发布。 但是,您可以自由使用,没有任何限制 — 了解更多信息这里。
免责声明
这些信息和出版物并非旨在提供,也不构成TradingView提供或认可的任何形式的财务、投资、交易或其他类型的建议或推荐。请阅读使用条款了解更多信息。