OPEN-SOURCE SCRIPT
Jikdi Double EMA and 200 EMA
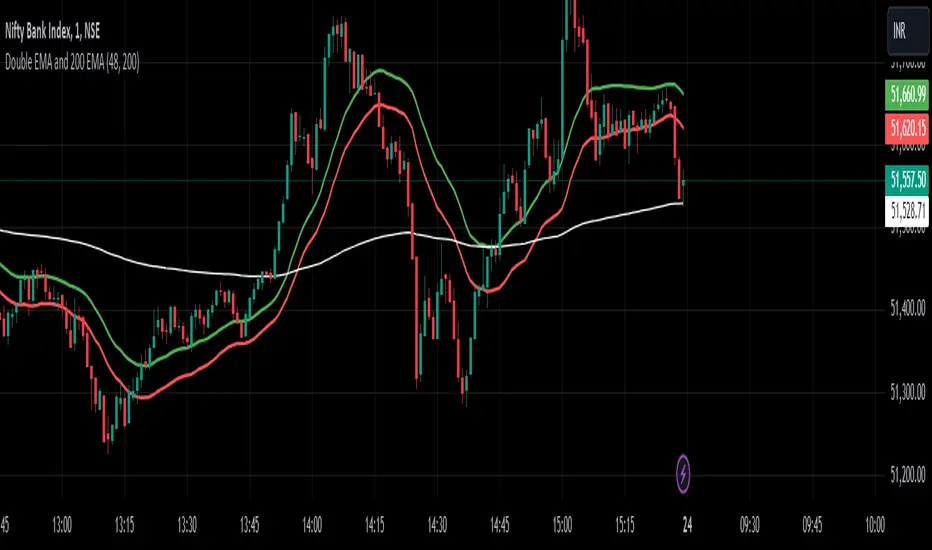
Double EMA and 200 EMA Indicator
Overview:
The Double EMA and 200 EMA indicator combines two exponential moving averages (EMA) to provide insights into short-term and longer-term trends in a financial instrument's price movements.
Components:
Double EMA:
Calculation: The Double EMA is derived by applying the EMA formula twice to a given price series. First, an EMA is calculated based on a specified length (parameter). Then, a second EMA is computed on the first EMA result, resulting in a smoother moving average that reacts more quickly to recent price changes compared to a single EMA.
Purpose: The Double EMA helps traders identify short-term trends by smoothing out price fluctuations, making it easier to spot potential entry and exit points based on momentum shifts.
200 EMA:
Calculation: The 200 EMA is calculated by applying the EMA formula to the closing prices of the financial instrument over a longer period, typically 200 periods.
Purpose: The 200 EMA is widely used by traders and analysts to assess the long-term trend direction of an asset. It acts as a key support or resistance level and is considered significant in determining the overall market sentiment and potential reversals.
Usage:
Short-term Trading: Traders use the Double EMA to identify short-term trends and trade opportunities. When the Double EMA crosses above the price, it may signal a bullish trend, while a cross below the price could indicate a bearish trend.
Long-term Analysis: The 200 EMA serves as a reference for long-term trend analysis. Prices trading above the 200 EMA suggest a bullish bias, while trading below it indicates a bearish sentiment.
Interpretation:
Crossovers: Crosses between the Double EMA and the 200 EMA or crosses of the Double EMA with the price can be potential signals for entry or exit positions, depending on the trading strategy employed.
Trend Confirmation: Traders often look for confluence between short-term (Double EMA) and long-term (200 EMA) trends to confirm the strength of a trend or to identify potential reversals.
Conclusion:
The Double EMA and 200 EMA indicator provides a comprehensive view of both short-term momentum and longer-term trend direction. By combining these moving averages, traders can make informed decisions based on the dynamics of price movements and trend confirmations.
开源脚本
秉承TradingView的精神,该脚本的作者将其开源,以便交易者可以查看和验证其功能。向作者致敬!您可以免费使用该脚本,但请记住,重新发布代码须遵守我们的网站规则。
免责声明
这些信息和出版物并非旨在提供,也不构成TradingView提供或认可的任何形式的财务、投资、交易或其他类型的建议或推荐。请阅读使用条款了解更多信息。
开源脚本
秉承TradingView的精神,该脚本的作者将其开源,以便交易者可以查看和验证其功能。向作者致敬!您可以免费使用该脚本,但请记住,重新发布代码须遵守我们的网站规则。
免责声明
这些信息和出版物并非旨在提供,也不构成TradingView提供或认可的任何形式的财务、投资、交易或其他类型的建议或推荐。请阅读使用条款了解更多信息。