PROTECTED SOURCE SCRIPT
已更新 Pro Volume Lite
📘 Pro Volume Lite
What it is:
Pro Volume Lite is a tool that helps you quickly figure out:
How much quantity to buy or sell,
Where your risk stands,
How volume and trend strength are behaving,
Plus some quick company fundamentals.
🔹 1. Position Size & Risk Management
✅ Settings
Trade Direction:
Long → Bullish trades only.
Short → Bearish trades only.
Both → Auto-switch depending on whether today’s price change is up or down.
Capital (CP):
Enter your account size (example: 10,00,000).
This is the base for position size calculations.
Risk Mode (R):
Currency → Risk a fixed amount per trade (e.g., $5000).
Percentage → Risk a fixed % of your capital (e.g., 0.5%).
⚡ The script automatically calculates how much money you’re risking per trade based on your choice.
✅ Stop & Quantity Calculations
D (Stop Low %) → How far today’s close is from the day’s low.
DH (Stop High %) → How far close is from the mid-body of today’s candle.
Q (Quantity) → How many shares you can buy/sell if stop = day’s low.
QH (Quantity High) → Quantity if stop = mid-body.
SSL #1, #2, #3 → Standard stop-loss setups (e.g., 0.75%, 1%, 1.25%).
💡 If you enable Lot Size, all quantities are converted into nearest lot multiples (good for futures).
🔹 2. Volume Bar Coloring
Green = Price closed higher than it opened.
Red = Price closed lower than it opened.
Plots on the volume chart so you can see bullish/bearish volume.
🔹 3. Trend Intensity (TI)
Uses two moving averages (fast & slow).
Green dot on top → Trend strongly bullish.
Red dot on top → Trend strongly bearish.
Helps you spot momentum shifts.
🔹 4. Episodic Pivot (EP)
Marks big volume spikes with orange triangles under candles.
Default threshold = 9 million volume.
Shows when institutions may be entering/exiting.
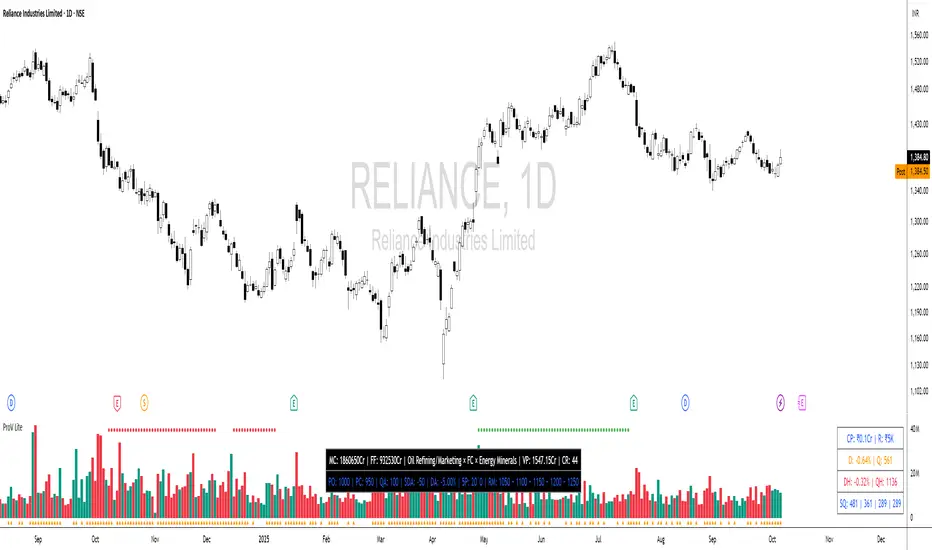
🔹 5. Data Metrics Table
Quick fundamentals shown in a table:
MC (Market Cap): Company’s total market value.
Industry × Sector: Classification for the stock.
FF (Free Float): Value of shares available for public trading.
💡 In INR stocks → values are shown in Crores.
💡 In USD stocks → values shown in raw currency format.
⚡ Bottom Line
Pro Volume Lite helps you:
Size your trades correctly,
Control your risk,
Spot strong volume moves,
Check quick fundamentals,
All inside your TradingView chart.
What it is:
Pro Volume Lite is a tool that helps you quickly figure out:
How much quantity to buy or sell,
Where your risk stands,
How volume and trend strength are behaving,
Plus some quick company fundamentals.
🔹 1. Position Size & Risk Management
✅ Settings
Trade Direction:
Long → Bullish trades only.
Short → Bearish trades only.
Both → Auto-switch depending on whether today’s price change is up or down.
Capital (CP):
Enter your account size (example: 10,00,000).
This is the base for position size calculations.
Risk Mode (R):
Currency → Risk a fixed amount per trade (e.g., $5000).
Percentage → Risk a fixed % of your capital (e.g., 0.5%).
⚡ The script automatically calculates how much money you’re risking per trade based on your choice.
✅ Stop & Quantity Calculations
D (Stop Low %) → How far today’s close is from the day’s low.
DH (Stop High %) → How far close is from the mid-body of today’s candle.
Q (Quantity) → How many shares you can buy/sell if stop = day’s low.
QH (Quantity High) → Quantity if stop = mid-body.
SSL #1, #2, #3 → Standard stop-loss setups (e.g., 0.75%, 1%, 1.25%).
💡 If you enable Lot Size, all quantities are converted into nearest lot multiples (good for futures).
🔹 2. Volume Bar Coloring
Green = Price closed higher than it opened.
Red = Price closed lower than it opened.
Plots on the volume chart so you can see bullish/bearish volume.
🔹 3. Trend Intensity (TI)
Uses two moving averages (fast & slow).
Green dot on top → Trend strongly bullish.
Red dot on top → Trend strongly bearish.
Helps you spot momentum shifts.
🔹 4. Episodic Pivot (EP)
Marks big volume spikes with orange triangles under candles.
Default threshold = 9 million volume.
Shows when institutions may be entering/exiting.
🔹 5. Data Metrics Table
Quick fundamentals shown in a table:
MC (Market Cap): Company’s total market value.
Industry × Sector: Classification for the stock.
FF (Free Float): Value of shares available for public trading.
💡 In INR stocks → values are shown in Crores.
💡 In USD stocks → values shown in raw currency format.
⚡ Bottom Line
Pro Volume Lite helps you:
Size your trades correctly,
Control your risk,
Spot strong volume moves,
Check quick fundamentals,
All inside your TradingView chart.
版本注释
Here are the new features added to the updated script, in bullet points:* **Manual Trade Input**: You can now manually enter your **Entry Price** and **Actual Quantity** after you've taken a trade.
* **Precise Stop-Loss Calculation**: Based on your manual entry, the script calculates the **exact stop-loss price** you need to use to stay within your planned risk.
* **"Parts Selling" Calculator**: A new tool helps you scale out of winning trades by showing you how to sell your position in equal, smaller parts.
* **R-Multiple Profit Targets**: The script now automatically calculates and displays multiple price targets based on your initial risk (e.g., where to take profits for a 1R, 2R, 3R gain).
* **"Volume × Price" (Turnover)**: A new metric was added to the data table, showing the total dollar value traded for the current bar.
* **Dedicated Trade Management Row**: A new row was added to the main data table to display all of the above information (your live trade entry, stop-loss, and profit targets) in one convenient place.
版本注释
Rearrangement of table cells.版本注释
Rearranged the table cells.版本注释
$DA & Parts Things removed.Added CR to the indicator.
版本注释
Added SQ#4.Remove Default Bar option.
版本注释
Added $DA.版本注释
Added Parts things with sell into strength.Secondary table orientation also is different.
Optimized for speed.
版本注释
Added F&O Status.Moved from manual Lot sizing to auto lot sizing.
版本注释
Minor Fix.版本注释
Minor Bug Fix. 版本注释
Changed Default Color Settings.受保护脚本
此脚本以闭源形式发布。 但是,您可以自由使用它,没有任何限制 — 在此处了解更多信息。
免责声明
这些信息和出版物并不意味着也不构成TradingView提供或认可的金融、投资、交易或其它类型的建议或背书。请在使用条款阅读更多信息。
受保护脚本
此脚本以闭源形式发布。 但是,您可以自由使用它,没有任何限制 — 在此处了解更多信息。
免责声明
这些信息和出版物并不意味着也不构成TradingView提供或认可的金融、投资、交易或其它类型的建议或背书。请在使用条款阅读更多信息。