OPEN-SOURCE SCRIPT
Repeating Trend Highlighter
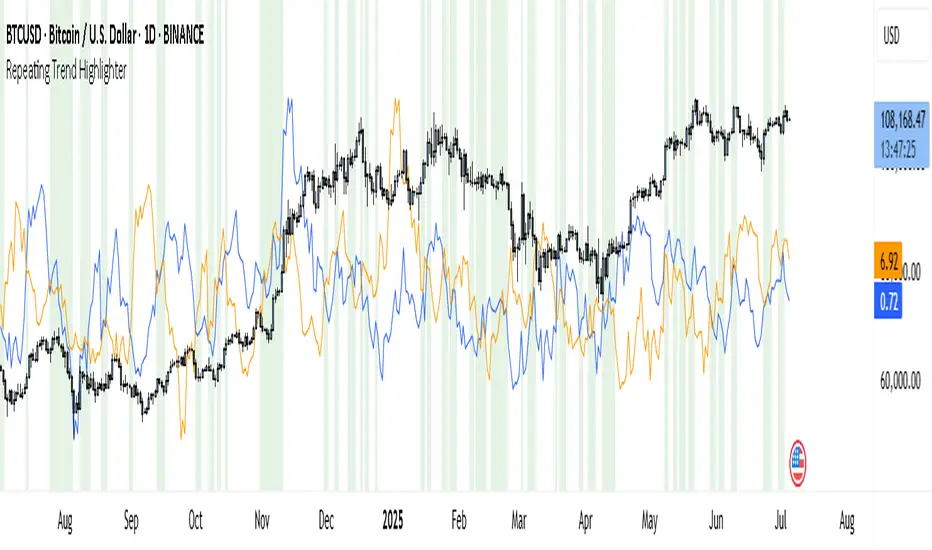
This custom indicator helps you see when the current price trend is similar to a past trend over the same number of candles. Think of it like checking whether the market is repeating itself.
You choose three settings:
• Lookback Period: This is how many candles you want to measure. For example, if you set it to 10, it looks at the price change over the last 10 bars.
• Offset Bars Ago: This tells the indicator how far back in time to look for a similar move. If you set it to 50, it compares the current move to what happened 50 bars earlier.
• Tolerance (%): This is how closely the moves must match to be considered similar. A smaller number means you only get a signal if the moves are almost the same, while a larger number allows more flexibility.
When the current price move is close enough to the past move you picked, the background of your chart turns light green. This makes it easy to spot repeating trends without studying numbers manually.
You’ll also see two lines under your chart if you enable them: a blue line showing the percentage change of the current move and an orange line showing the change in the past move. These help you compare visually.
This tool is useful in several ways. You can use it to confirm your trading setups, for example if you suspect that a strong rally or pullback is happening again. You can also use it to filter trades by combining it with other indicators, so you only enter when trends repeat. Many traders use it as a learning tool, experimenting with different lookback periods and offsets to understand how often similar moves happen.
If you are a scalper working on short timeframes, you can set the lookback to a small number like 3–5 bars. Swing traders who prefer daily or weekly charts might use longer lookbacks like 20–30 bars.
Keep in mind that this indicator doesn’t guarantee price will move the same way again—it only shows similarity in how price changed over time. It works best when you use it together with other signals or market context.
In short, it’s like having a simple spotlight that tells you: “This move looks a lot like what happened before.” You can then decide if you want to act on that information.
If you’d like, I can help you tweak the settings or combine it with alerts so it notifies you when these patterns appear.
开源脚本
秉承TradingView的精神,该脚本的作者将其开源,以便交易者可以查看和验证其功能。向作者致敬!您可以免费使用该脚本,但请记住,重新发布代码须遵守我们的网站规则。
Trade forex, indices, stocks and metals with up to US$100.000 in company's funding.
Complete a challenge to access funding or go for instant deposit.
Trading involves substantial risk. Not financial advice
Complete a challenge to access funding or go for instant deposit.
Trading involves substantial risk. Not financial advice
免责声明
这些信息和出版物并非旨在提供,也不构成TradingView提供或认可的任何形式的财务、投资、交易或其他类型的建议或推荐。请阅读使用条款了解更多信息。