OPEN-SOURCE SCRIPT
已更新 BB With Buy & Sell Signaling by mattzab
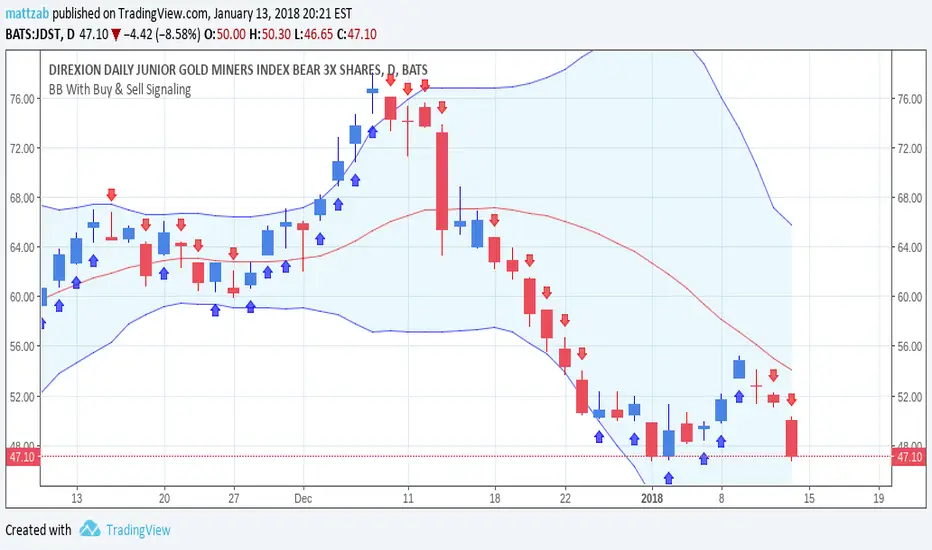
This is an unmodified Bollinger Band, with the addition of buy/sell arrows.
No arrow = hold the position (whether in or out)
Blue up = buy
Red down = sell
Arrows are produced by MACD histogram moving in the same direction as price.
MACD settings are:
Fast EMA = 10
Slow EMA = 20
Signal Smoothing SMA = 5
No arrow = hold the position (whether in or out)
Blue up = buy
Red down = sell
Arrows are produced by MACD histogram moving in the same direction as price.
MACD settings are:
Fast EMA = 10
Slow EMA = 20
Signal Smoothing SMA = 5
版本注释
Cleaned up and commented code.版本注释
Changed from Close Price to Average of High & Low Point.版本注释
Removed more whiplash. Modified some stuff regarding close, hl2, and hlc3. The buy/sell points seem to be more accurate now.If someone can show me how to prevent multiple consecutive buy arrows and sell arrows I'd appreciate it. Fewer arrows would be nice. Just a single buy, followed by a single sell, followed by a single buy, single sell, etc.
Email me, my username at gmail. Thanks!
版本注释
Cleaned up the arrows so there are fewer consecutive signals.版本注释
Cleaned up the arrows more. Now you should almost always only get a buy signal if the last signal was a sell, and only get a sell if previous signal was a buy. Not sure fire, but should work in most cases.版本注释
Added a blue and red line out in front of price to show how close the next signal is.Full Explanation:
This will overlay standard Bollinger Bands, with these additions:
Blue Up Arrow - Buy Signal
Red Down Arrow - Sell Signal
To the right of the current price:
Horizontal Blue and Red Lines - These show you how close you are to getting the opposite signal. When blue is above red, you are in buy/hold territory. When blue is below red, you are in sell/wait territory. The purpose of these red and blue horizontal lines out in front of price is to show you how close you are to getting an opposite buy/sell signal.
版本注释
Removed previous changes: not functioning properly. Code commented. Fix if you can figure out how. Email me the fix. My username at gmail.版本注释
This script now produces Standard Bollinger Bands, Buy/Sell arrows based on the 10,20,5 MACD Histogram (using high/low/close average) direction in relation to Price high/low average, and tack lines that indicate how close the next arrow is to coming around.The script isn't perfect, but I don't know what to do to get the tack lines to the right of price to be more accurate to the buy/sell arrows.
Email me if you have any ideas.
版本注释
Minor Tweaks for accuracy on the tack marks. Still needs improvement for better accuracy, email me if you can figure out the math I'm missing.开源脚本
秉承TradingView的精神,该脚本的作者将其开源,以便交易者可以查看和验证其功能。向作者致敬!您可以免费使用该脚本,但请记住,重新发布代码须遵守我们的网站规则。
免责声明
这些信息和出版物并非旨在提供,也不构成TradingView提供或认可的任何形式的财务、投资、交易或其他类型的建议或推荐。请阅读使用条款了解更多信息。
免责声明
这些信息和出版物并非旨在提供,也不构成TradingView提供或认可的任何形式的财务、投资、交易或其他类型的建议或推荐。请阅读使用条款了解更多信息。