OPEN-SOURCE SCRIPT
HLC3_Z
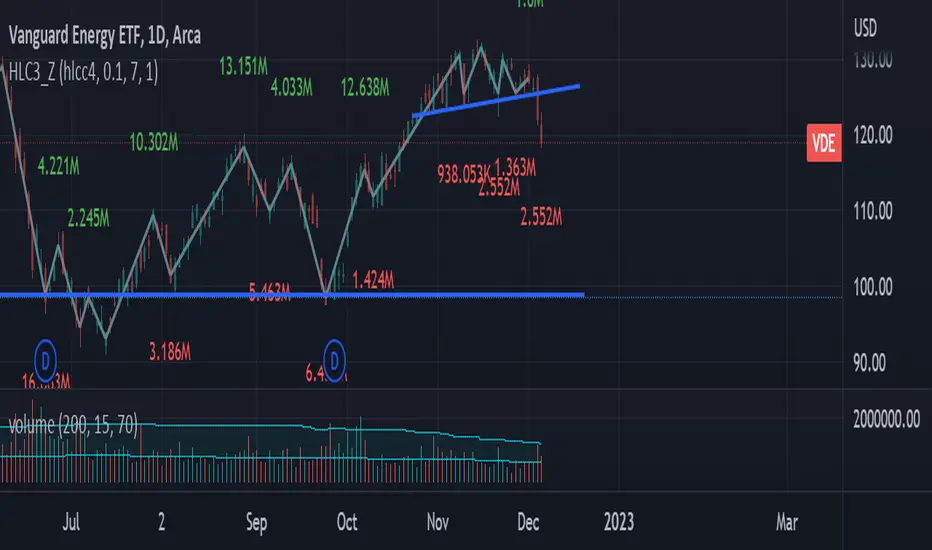
This indicator uses a single price point for each session (HLC3 by default) to draw waves.
This helps to filter out small or high frequency fluctuation in the price, and focus on the trend.
There are also options to display cumulative volume for each wave, or to overlay the price source to draw the wave on the chart.
I find using this indicator helps with finding the wave structures or the head or bottom structures such as head-and-shoulder.
开源脚本
秉承TradingView的精神,该脚本的作者将其开源,以便交易者可以查看和验证其功能。向作者致敬!您可以免费使用该脚本,但请记住,重新发布代码须遵守我们的网站规则。
免责声明
这些信息和出版物并非旨在提供,也不构成TradingView提供或认可的任何形式的财务、投资、交易或其他类型的建议或推荐。请阅读使用条款了解更多信息。
开源脚本
秉承TradingView的精神,该脚本的作者将其开源,以便交易者可以查看和验证其功能。向作者致敬!您可以免费使用该脚本,但请记住,重新发布代码须遵守我们的网站规则。
免责声明
这些信息和出版物并非旨在提供,也不构成TradingView提供或认可的任何形式的财务、投资、交易或其他类型的建议或推荐。请阅读使用条款了解更多信息。