OPEN-SOURCE SCRIPT
已更新 Candle Percentage Change
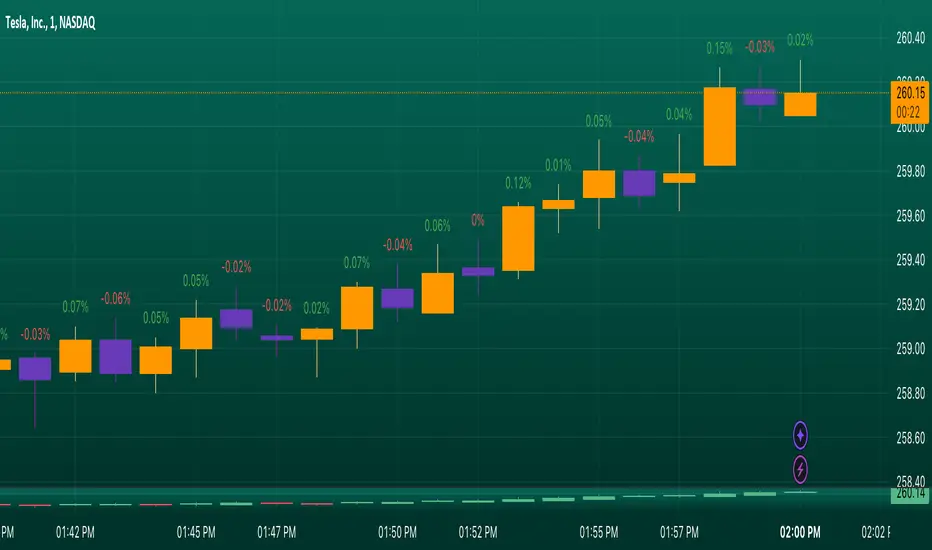
ndicator Setup: The script creates an indicator that overlays on the price chart.
Percentage Calculation: It calculates the percentage change between the current and previous candle closes.
Percentage Calculation: It calculates the percentage change between the current and previous candle closes.
版本注释
Key Features:Percentage Change Calculation:
The script calculates the percentage change between the closing price of the current candle and the previous candle.
The text color of the percentage change is determined based on the direction of the candle:
Green for bullish candles (close > open).
Red for bearish candles (close < open).
Label Positioning:
The percentage change label is positioned slightly above the high of each candle to ensure visibility and avoid overlap with the candle body.
The label uses the syminfo.mintick variable to maintain appropriate spacing based on the instrument's tick size.
Label Creation:
A new label is created for each candle, displaying the calculated percentage change as text.
The label has a transparent background for a cleaner appearance on the chart.
Usage:
This indicator can be added to any price chart in TradingView. It allows traders to assess price movements quickly, identify trends, and make informed trading decisions based on recent price changes.
Example of Use:
A trader looking at a candlestick chart can easily spot how much the price has changed between each candle. For instance, a label showing "+2.35%" indicates a 2.35% increase from the previous close, while "-1.20%" indicates a 1.20% decrease.
This script is particularly useful for day traders, swing traders, and anyone interested in analyzing price action with a clear visual representation of percentage changes in the market.
版本注释
Indicator Setup: The script creates an indicator that overlays on the price chart.Percentage Calculation: It calculates the percentage change between the current and previous candle closes.
Key Features:
Percentage Change Calculation:
The script calculates the percentage change between the closing price of the current candle and the previous candle.
The text color of the percentage change is determined based on the direction of the candle:
Green for bullish candles (close > open).
Red for bearish candles (close < open).
Usage:
This indicator can be added to any price chart in TradingView. It allows traders to assess price movements quickly, identify trends, and make informed trading decisions based on recent price changes.
Example of Use:
A trader looking at a candlestick chart can easily spot how much the price has changed between each candle. For instance, a label showing "+2.35%" indicates a 2.35% increase from the previous close, while "-1.20%" indicates a 1.20% decrease.
This script is particularly useful for day traders, swing traders, and anyone interested in analyzing price action with a clear visual representation of percentage changes in the market.
版本注释
Label overlapping issues fixed.版本注释
Label position fixed开源脚本
秉承TradingView的精神,该脚本的作者将其开源,以便交易者可以查看和验证其功能。向作者致敬!您可以免费使用该脚本,但请记住,重新发布代码须遵守我们的网站规则。
免责声明
这些信息和出版物并非旨在提供,也不构成TradingView提供或认可的任何形式的财务、投资、交易或其他类型的建议或推荐。请阅读使用条款了解更多信息。
开源脚本
秉承TradingView的精神,该脚本的作者将其开源,以便交易者可以查看和验证其功能。向作者致敬!您可以免费使用该脚本,但请记住,重新发布代码须遵守我们的网站规则。
免责声明
这些信息和出版物并非旨在提供,也不构成TradingView提供或认可的任何形式的财务、投资、交易或其他类型的建议或推荐。请阅读使用条款了解更多信息。