OPEN-SOURCE SCRIPT
已更新 Upside Downside Unchanged Volume
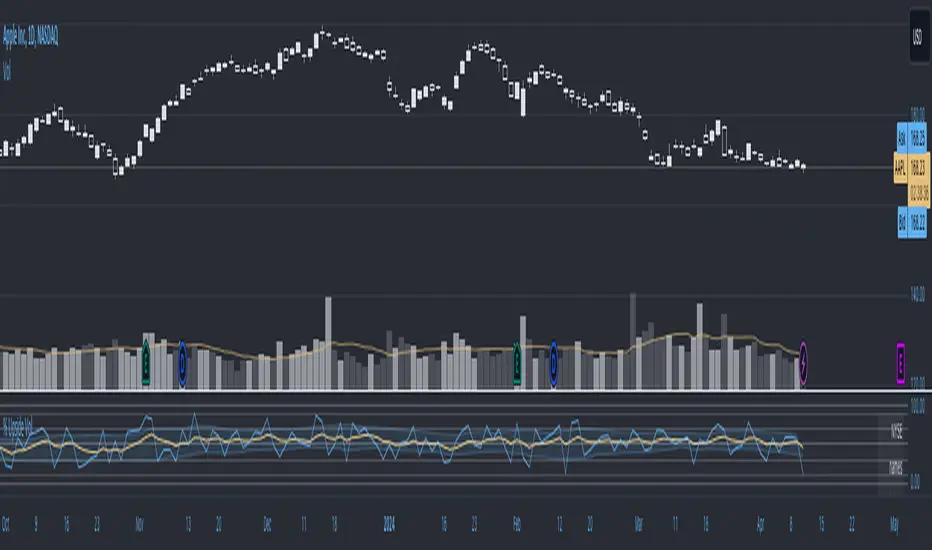
Upside Downside Unchanged Volume
- Plot NYSE or NASDAQ Upside Volume, Downside Volume, or Unchanged Volume (e.g. UPVOL.NY, UVOL, or ADVN.NY) as a percent (values 0 to 1, where 1 = 100%) of Total Volume.
- Plot Day, Week, and Month volume and/or chart timeframe period volume.
- Plot volume as a histogram, line, or area.
- Plot various moving averages of volume points.
- Horizontal lines at 0, 10, 30, 50, 70, 90, and 100% levels.
- Inspired by Paul Desmond of Lowry’s Reports.
版本注释
Updated script notes:- Plot NYSE or NASDAQ Upside Volume, Downside Volume, or Unchanged Volume as a percent of Total Volume.
- Values are plotted 0 to 1, where 1 = 100%.
- Example of variables: USI:UPVOL.NY/DNVOL.NY/UNCHVOL.NY vs USI:TVOL.NY (Volume), USI:UVOL/DVOL/XVOL vs USI:TVOL (Volume), and USI:ADVN.NY/DECL.NY/UNCH.NY vs USI:ACTV.NY (Issues)
- Plot Day, Week, and Month volume and/or chart timeframe period volume.
- Plot volume as a histogram, line, or area.
- Plot various moving averages of volume points.
- Horizontal lines at 0, .10, .30, .50, .70, .90, and 1.00 levels.
- Inspired by Paul Desmond of Lowry’s Reports.
版本注释
Added moving averages from values above or below a specified % of total volume.版本注释
Changed settings titles版本注释
Added notes.版本注释
fixed errors版本注释
Edited section headings版本注释
added a table to report the current percent up or down版本注释
edited table版本注释
changed colors and defaults版本注释
Corrected an error in the code.开源脚本
秉承TradingView的精神,该脚本的作者将其开源,以便交易者可以查看和验证其功能。向作者致敬!您可以免费使用该脚本,但请记住,重新发布代码须遵守我们的网站规则。
免责声明
这些信息和出版物并非旨在提供,也不构成TradingView提供或认可的任何形式的财务、投资、交易或其他类型的建议或推荐。请阅读使用条款了解更多信息。
开源脚本
秉承TradingView的精神,该脚本的作者将其开源,以便交易者可以查看和验证其功能。向作者致敬!您可以免费使用该脚本,但请记住,重新发布代码须遵守我们的网站规则。
免责声明
这些信息和出版物并非旨在提供,也不构成TradingView提供或认可的任何形式的财务、投资、交易或其他类型的建议或推荐。请阅读使用条款了解更多信息。