OPEN-SOURCE SCRIPT
Price Outpaces Moving Average
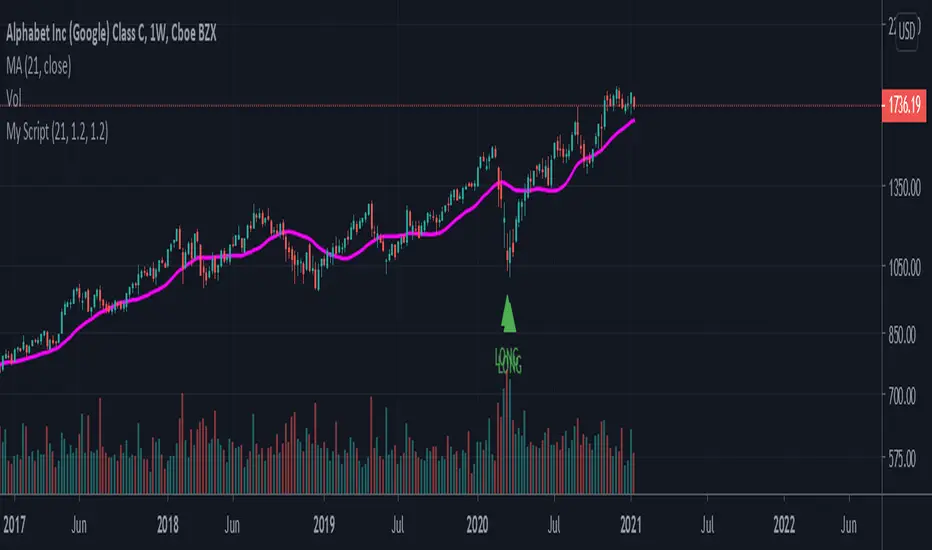
With inputs for the moving average, Bullish overshoot percentage, and bearish overshoot percentage, this indicator is attempting to show market tops based on the difference between the current price of an asset and how far away it is from its moving average.
If you have the bullish overshoot percentage set to 1.5:
let's say price is currently at 20,000 and the moving average is around 6500.
The script calculates 20,000/6500 = 3.07
Then, there is a boolean comparison asking if 3.07 > 1.5.
Since it is, the script will create a "SHORT" flag above that candlestick.
A similar process happens for the "LONG" flags.
开源脚本
秉承TradingView的精神,该脚本的作者将其开源,以便交易者可以查看和验证其功能。向作者致敬!您可以免费使用该脚本,但请记住,重新发布代码须遵守我们的网站规则。
免责声明
这些信息和出版物并非旨在提供,也不构成TradingView提供或认可的任何形式的财务、投资、交易或其他类型的建议或推荐。请阅读使用条款了解更多信息。
开源脚本
秉承TradingView的精神,该脚本的作者将其开源,以便交易者可以查看和验证其功能。向作者致敬!您可以免费使用该脚本,但请记住,重新发布代码须遵守我们的网站规则。
免责声明
这些信息和出版物并非旨在提供,也不构成TradingView提供或认可的任何形式的财务、投资、交易或其他类型的建议或推荐。请阅读使用条款了解更多信息。