INVITE-ONLY SCRIPT
SFC Smart Money - Volatility
In statistics, a normal distribution is a type of continuous probability distribution for a real-valued random variable. Normal distributions are important in statistics and are often used in the natural and social sciences to represent real-valued random variables whose distributions are not known.
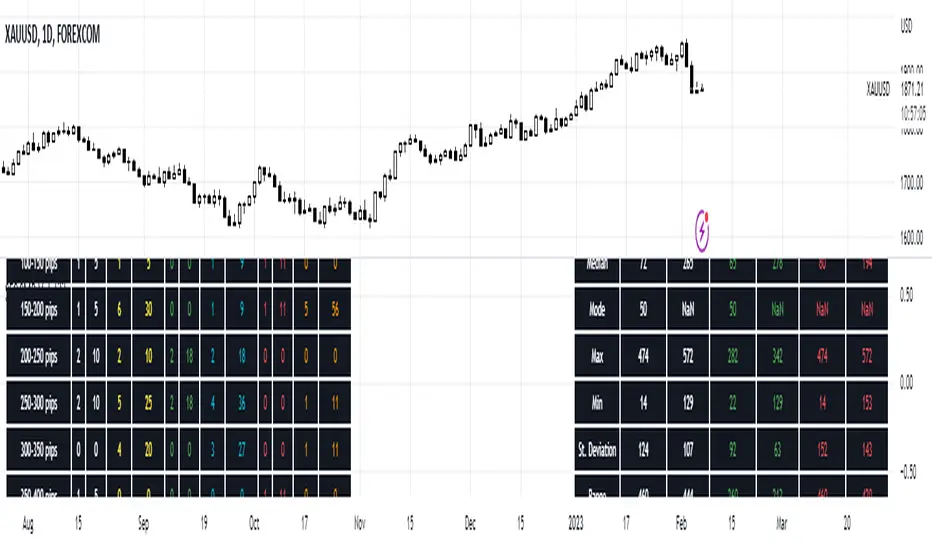
The indicator provide a deep statistic for the specified period. It calculate the normal distribution of all candles in the particular period, in order to measure the volatility and the probabilities. Also it separate bull from bear candles and calculate the normal distribution of each group. The calculations are mode based on open-open data and high-low data.
Volatility
Volatility is a statistical measure of the dispersion of returns for a given security or market index. In most cases, the higher the volatility , the riskier the security. Volatility is often measured from either the standard deviation or variance between returns from that same security or market index.
Volatility often refers to the amount of uncertainty or risk related to the size of changes in a security's value. A higher volatility means that a security's value can potentially be spread out over a larger range of values. This means that the price of the security can change dramatically over a short time period in either direction. A lower volatility means that a security's value does not fluctuate dramatically, and tends to be more steady.
While variance captures the dispersion of returns around the mean of an asset in general, volatility is a measure of that variance bounded by a specific period of time. Thus, we can report daily volatility , weekly, monthly, or annualized volatility .
This statistic gives very accurate information how the price moved in the past and what are normal movements and spikes. From this information, a future actions can be taken.
For better understanding, all data is calculated in pips.
Features:
- Mean - Mean is the one we are most used to, i.e. the average.
- Median -Sometimes, the data set values can have a few values which are at the extreme ends, and this might cause the mean of the data set to portray an incorrect picture.
Thus, we use the median, which gives the middle value of the sorted data set.
- Mode - In a given dataset, the mode will be the number which is occurring the most.
- Max - Maximum volatility for a given range.
- Min - Minimum volatility for a given range.
- Standard Deviation - The standard deviation tells us how far the value deviates from the mean.
- Range - Range simply gives the difference between the min and max values of the data set.
- ATR - Average True Range measures volatility, taking into account any gaps in the price movement.
- Normal Distribution - The basic premise is that given a range of observations, it is found that most of the values center around the mean and within one standard deviation
away from the mean.
- Probability - probability of outcomes.
We all know that the banks and professional traders do not trade with charts, but with different statistical methods, math. models and macroeconomics. This statistical indicator shows one of these methods.
It is recommended to use the indicator on daily timeframe . It also works on other timeframes, for example 1H for intraday analysis.
For more information how the normal distribution works, please search in internet.
仅限邀请脚本
仅限作者授权的用户访问此脚本,并且通常需要付费。您可以将其添加到收藏中,但是只有在向作者请求并获得许可之后,才能使用它。 请联系SerpentForexClub了解更多信息,或按照以下作者的说明操作。
TradingView不建议付费使用脚本,除非您100%信任作者并了解脚本的工作原理。在许多情况下,您可以在我们的社区脚本免费找到不错的开源替代方案。
作者的说明
″Contact me through PM system.
想在图表上使用此脚本?
警告:请在申请访问权限之前阅读。
免责声明
这些信息和出版物并不意味着也不构成TradingView提供或认可的金融、投资、交易或其它类型的建议或背书。请在使用条款阅读更多信息。