OPEN-SOURCE SCRIPT
已更新 Periodic Moving Averages

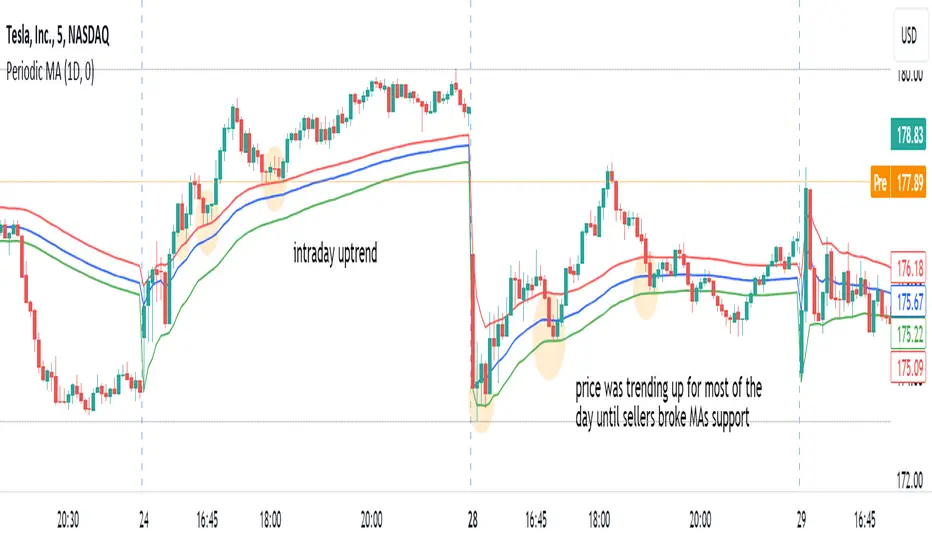
Indicator plots three simple moving averages (MA) that are reset at the beginning of period, specified by a user.
Moving averages often act as support /resistance levels. They can also help to identify intraday trend. It is important to realize that none of the moving averages is universal as price behavior changes from day to day. On the chart I’ve highlighted several occurrences when one of MAs (different ones) provided support for price.
Parameters:
PERIOD – period for which MAs are plotted. They are reset at the beginning of each period. Period cannot be lower than chart’s timeframe
LENGTH – length of moving averages. If set to 0 then parameter is ignored and MAs are calculated on all bars, available in the period
VWAP? – if checked then moving averages will be calculated as volume weighted price
Disclaimer
This indicator should not be used as a standalone tool to make trading decisions but only in conjunction with other technical analysis methods.
- Red MA is based on highs
- Blue MA is based on close
- Green MA one is based on lows.
Moving averages often act as support /resistance levels. They can also help to identify intraday trend. It is important to realize that none of the moving averages is universal as price behavior changes from day to day. On the chart I’ve highlighted several occurrences when one of MAs (different ones) provided support for price.
Parameters:
PERIOD – period for which MAs are plotted. They are reset at the beginning of each period. Period cannot be lower than chart’s timeframe
LENGTH – length of moving averages. If set to 0 then parameter is ignored and MAs are calculated on all bars, available in the period
VWAP? – if checked then moving averages will be calculated as volume weighted price
Disclaimer
This indicator should not be used as a standalone tool to make trading decisions but only in conjunction with other technical analysis methods.
版本注释
UPD 1.1. added two features:- SIGNALS. Indicator will highlight occurrences where one of MAs acted as support (green box) or resistance (red box) level. The capital letter and number tell which MA was in play and how many times in the period
- TREND. Indicator will show trend in the period. Green filling means price is trending up; red means down; no coloring means uncertainty.
The logic of both features is not very sophisticated and should be treated more as an illustration of the concepts rather than a trading tool.
版本注释
UPD 1.2. Support/Resistance counter is reset if price breaks MA. Minor changes of visuals开源脚本
秉承TradingView的精神,该脚本的作者将其开源,以便交易者可以查看和验证其功能。向作者致敬!您可以免费使用该脚本,但请记住,重新发布代码须遵守我们的网站规则。
免责声明
这些信息和出版物并非旨在提供,也不构成TradingView提供或认可的任何形式的财务、投资、交易或其他类型的建议或推荐。请阅读使用条款了解更多信息。
开源脚本
秉承TradingView的精神,该脚本的作者将其开源,以便交易者可以查看和验证其功能。向作者致敬!您可以免费使用该脚本,但请记住,重新发布代码须遵守我们的网站规则。
免责声明
这些信息和出版物并非旨在提供,也不构成TradingView提供或认可的任何形式的财务、投资、交易或其他类型的建议或推荐。请阅读使用条款了解更多信息。