INVITE-ONLY SCRIPT
Extreme Trend Amplifier (ETA)
Introduction
This indicator was created in V3 Pinescript and all projections will be displayed in real-time for active trading use.
This indicator has been designed so that it can be used across a range of securities such as equities, bonds, FX and cryptocurrencies.
All time-stamps are supported.
Comment and Like to try it out!
Understanding the Extreme Trend Amplifier
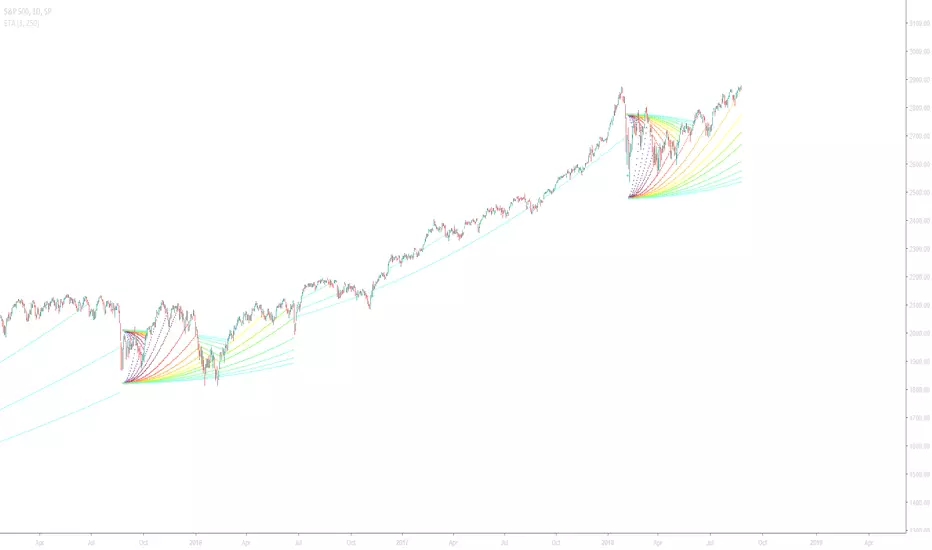
Extreme price changes are often result in a change of trend. This indicator not only allows you to identify the breakout, but to follow the direction of the change. Below is an example of the indicator using normal input values and the Dark TradingView Theme.

The Extreme Trend Amplifier is an indicator that measures the rate of change within a bar of the time stamp and plots a function when the user-defined threshold has been breached. The plot projects parabolic lines that squeeze towards the market price at an ever-increasing rate. The acceleration can also be defined in the indicator settings panel.
Indicator Utility
The first example below is the forex pair, AUD/USD using a rate threshold of 1% and an acceleration factor of three and the second using a rate threshold of 0.8% and an acceleration factor of nine.

We can observe that an increased rate threshold results in fewer instances and that a higher acceleration factor results in the instance projecting farther.
Notice that the acceleration factor is inversely related.
Input Values
Select the “Format”, button located next to the indicator label to adjust the input values and the style.
Rate of change (ROC) is the percentage rise/fall of the security within the time stamp. If ROC is set to 1, this is directly proportionate to 1%.
Securities such as cryptocurrencies are very volatile and will require an increased threshold.
Forex pairs will require a reduced threshold in order to produce an output as volatility is far less.
The line color, thickness and style can also be personalised to customise the strategy even further.

In this example, I have adjusted the projected instance that appears below the bars blue and above the bars red, indicating an uptrend or downtrend.
It is also possible to change specific bars in order to identify the extent to which a trend has continued as seen below.

If you would to find out more about this indicator, visit kenzing.com
This indicator was created in V3 Pinescript and all projections will be displayed in real-time for active trading use.
This indicator has been designed so that it can be used across a range of securities such as equities, bonds, FX and cryptocurrencies.
All time-stamps are supported.
Comment and Like to try it out!
Understanding the Extreme Trend Amplifier
Extreme price changes are often result in a change of trend. This indicator not only allows you to identify the breakout, but to follow the direction of the change. Below is an example of the indicator using normal input values and the Dark TradingView Theme.
The Extreme Trend Amplifier is an indicator that measures the rate of change within a bar of the time stamp and plots a function when the user-defined threshold has been breached. The plot projects parabolic lines that squeeze towards the market price at an ever-increasing rate. The acceleration can also be defined in the indicator settings panel.
Indicator Utility
The first example below is the forex pair, AUD/USD using a rate threshold of 1% and an acceleration factor of three and the second using a rate threshold of 0.8% and an acceleration factor of nine.
We can observe that an increased rate threshold results in fewer instances and that a higher acceleration factor results in the instance projecting farther.
Notice that the acceleration factor is inversely related.
Input Values
Select the “Format”, button located next to the indicator label to adjust the input values and the style.
Rate of change (ROC) is the percentage rise/fall of the security within the time stamp. If ROC is set to 1, this is directly proportionate to 1%.
Securities such as cryptocurrencies are very volatile and will require an increased threshold.
Forex pairs will require a reduced threshold in order to produce an output as volatility is far less.
The line color, thickness and style can also be personalised to customise the strategy even further.
In this example, I have adjusted the projected instance that appears below the bars blue and above the bars red, indicating an uptrend or downtrend.
It is also possible to change specific bars in order to identify the extent to which a trend has continued as seen below.
If you would to find out more about this indicator, visit kenzing.com
仅限邀请脚本
只有作者授权的用户才能访问此脚本。您需要申请并获得使用许可。通常情况下,付款后即可获得许可。更多详情,请按照下方作者的说明操作,或直接联系GrantPeace。
TradingView不建议您付费购买或使用任何脚本,除非您完全信任其作者并了解其工作原理。您也可以在我们的社区脚本找到免费的开源替代方案。
作者的说明
Kenzing trading indicators for TradingView perform advanced real-time analysis of stock price trends and display alerts that are easy for the average Trader to interpret.
kenzing.com
kenzing.com
免责声明
这些信息和出版物并非旨在提供,也不构成TradingView提供或认可的任何形式的财务、投资、交易或其他类型的建议或推荐。请阅读使用条款了解更多信息。