OPEN-SOURCE SCRIPT
已更新 Bull Market Support Band (20w SMA, 21w EMA)
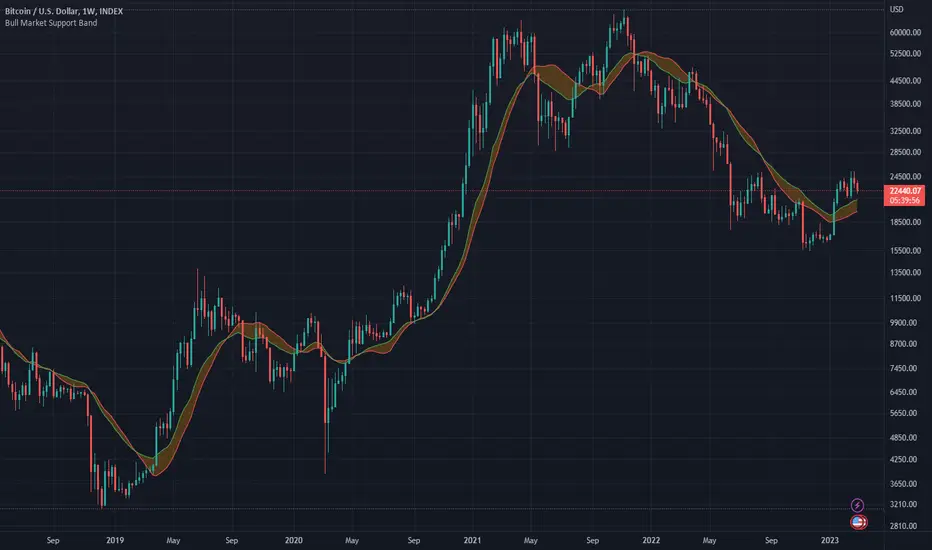
This moving average indicator is a bull market support band. It's significance comes from the previous bull runs where the price was bouncing off or riding from a distance the support band until the end of the market cycle. For example, during the 2017 bull run, Bitcoin had several 30-40% corrections to the support band.
The green line represents the 20 weeks simple moving average and the red line represents the 21 weeks exponential moving average. The best way to read the current value is to look at the weekly chart, but any time frame will display the same values.
The green line represents the 20 weeks simple moving average and the red line represents the 21 weeks exponential moving average. The best way to read the current value is to look at the weekly chart, but any time frame will display the same values.
版本注释
Smooth lines on non-weekly timeframes.版本注释
Removed deprecated "color" attribute in "fill" function and changed "color" attribute accordingly.版本注释
Fixed a bug where changing the indicator timeframe does not change the lengths of the moving averages. 版本注释
Bumped the version to v5.版本注释
Fixed a bug where there is a gap between the latest indicator data and the chart's latest data on timeframes lower than weekly.版本注释
Reverted last big fix since it is removed multi timeframe functionality.版本注释
Same as above开源脚本
本着TradingView的真正精神,此脚本的创建者将其开源,以便交易者可以查看和验证其功能。向作者致敬!虽然您可以免费使用它,但请记住,重新发布代码必须遵守我们的网站规则。
免责声明
这些信息和出版物并不意味着也不构成TradingView提供或认可的金融、投资、交易或其它类型的建议或背书。请在使用条款阅读更多信息。
免责声明
这些信息和出版物并不意味着也不构成TradingView提供或认可的金融、投资、交易或其它类型的建议或背书。请在使用条款阅读更多信息。