OPEN-SOURCE SCRIPT
已更新 SMA Proximity Signal with Trend Table
Summary of the Script:
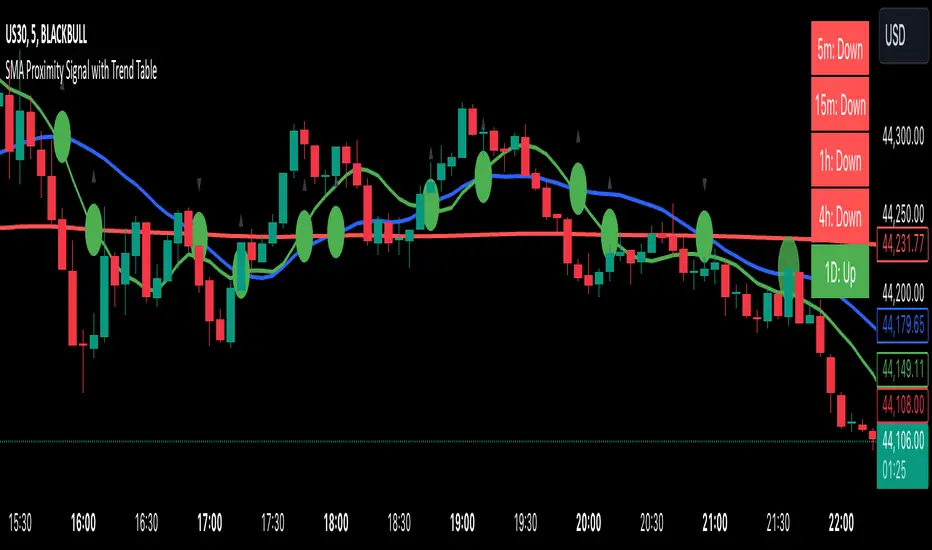
This Pine Script is designed to provide a variety of technical analysis signals based on Simple Moving Averages (SMAs) and market trends across different timeframes. The script combines multiple indicators, such as the SMA crossover, proximity conditions, and trend analysis, along with visual markers and support/resistance lines. Below is a detailed breakdown of the key features:
The script detects crossovers between SMA1 and SMA2 and SMA1 and SMA3, marking them with green circles exactly at the crossover price level (not on the candles).
The crossover events are identified using ta.crossover and ta.crossunder functions.
Additional circles are drawn when other SMAs are in proximity (narrow stage)
Elephant Candle Pattern:
The script identifies "Elephant Candles" based on a large candle body relative to the overall size of the candle, using the condition where the candle body is at least 80% of the total candle size and at least 1.5 times the average candle size.
These candles are marked with an elephant emoji 🐘 at the top of the candle.
Trend Analysis Across Multiple Timeframes:
The script calculates the trend for different timeframes using the SMA20 of each timeframe:
5m, 15m, 1h, 4h, and 1D
It compares the current SMA20 to its previous value to determine whether the trend is Up, Down, or Flat.
版本注释
Visualization:SMA Plots: The SMAs are plotted as lines with different colors.
Crossover Markers: Green circles are placed exactly at the price level of the SMA crossovers.
Proximity Signals: Green circles are used to indicate when the SMAs are flat and close.
Support/Resistance Lines: Red vertical lines are drawn when the price is near support or resistance levels.
Trend Table: A table in the top-right corner shows the trend across multiple timeframes, with color-coding for each trend direction.
开源脚本
秉承TradingView的精神,该脚本的作者将其开源,以便交易者可以查看和验证其功能。向作者致敬!您可以免费使用该脚本,但请记住,重新发布代码须遵守我们的网站规则。
免责声明
这些信息和出版物并非旨在提供,也不构成TradingView提供或认可的任何形式的财务、投资、交易或其他类型的建议或推荐。请阅读使用条款了解更多信息。
开源脚本
秉承TradingView的精神,该脚本的作者将其开源,以便交易者可以查看和验证其功能。向作者致敬!您可以免费使用该脚本,但请记住,重新发布代码须遵守我们的网站规则。
免责声明
这些信息和出版物并非旨在提供,也不构成TradingView提供或认可的任何形式的财务、投资、交易或其他类型的建议或推荐。请阅读使用条款了解更多信息。