OPEN-SOURCE SCRIPT
已更新 RSI Scalping Gold (XAUUSD) - v5
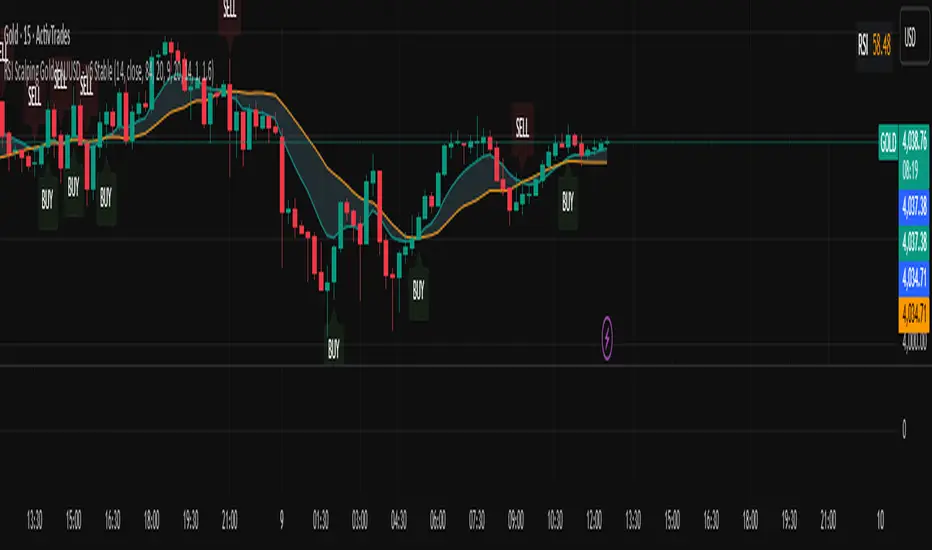
Displays the EMA9 and SMA20 to identify the trend.
Colors the area between the two averages to better visualize the equilibrium zone.
Displays green (buy) and red (sell) arrows aligned with the candles.
The RSI is calculated but hidden from the main chart (you can activate it by checking “Display on chart” in the settings).
Colors the area between the two averages to better visualize the equilibrium zone.
Displays green (buy) and red (sell) arrows aligned with the candles.
The RSI is calculated but hidden from the main chart (you can activate it by checking “Display on chart” in the settings).
版本注释
What this version adds:Visible and offset arrows and labels → clearer across all timeframes.
SL/TP directly on the label for each signal.
EMA9/SMA20 zone with transparent sky blue background.
Automatic BUY/SELL alerts as soon as the signal appears.
RSI chart updated in real time.
开源脚本
本着TradingView的真正精神,此脚本的创建者将其开源,以便交易者可以查看和验证其功能。向作者致敬!虽然您可以免费使用它,但请记住,重新发布代码必须遵守我们的网站规则。
免责声明
这些信息和出版物并不意味着也不构成TradingView提供或认可的金融、投资、交易或其它类型的建议或背书。请在使用条款阅读更多信息。
开源脚本
本着TradingView的真正精神,此脚本的创建者将其开源,以便交易者可以查看和验证其功能。向作者致敬!虽然您可以免费使用它,但请记住,重新发布代码必须遵守我们的网站规则。
免责声明
这些信息和出版物并不意味着也不构成TradingView提供或认可的金融、投资、交易或其它类型的建议或背书。请在使用条款阅读更多信息。