OPEN-SOURCE SCRIPT
已更新 Ultimate Volume
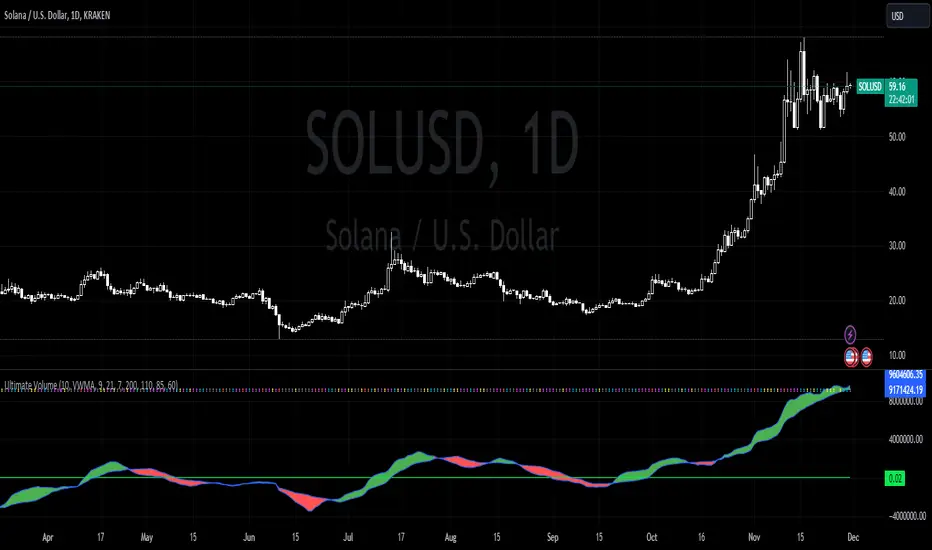
The Ultimate Volume indicator combines three volume calculations and plots each signal in a single indicator. Behold!
Relative Volume
an indicator that tells traders how current volume is compared to past trading volumes over a given period. It is kind of like a radar for how “in-play” a stock is. The higher the relative volume is, the more in play it is. Relative Volume is displayed as a ratio. So if it is showing 3.5 relative volume, that means it is trading at 3.5 times its normal volume.
Plotted as a green number on the chart
Trend Volume
An extension to "On Balance Volume Momentum (OBV Momentum)".
"OBV Trend" is a trend strength indicator, that can be used to identify strong trends and also trend changes based on volume.
High positive values indicate strong volume on the buy side, high negative values indicate strong volume on the sell side.
An increasing OBV trend indicates a strengthening buy trend or a weakening sell trend,
decreasing OBV trend indicates a strengthening sell trend or weakening buy trend.
OBV trend is calculated by plotting a short vs. a long moving average and filling the difference in volume.
Volume Arrows
As a general rule, when a stock goes up on low volume, it's seen as negative because it means buyers aren't committed. When a stock goes down on low volume, it means that not many people are trying to sell it, which is positive. The indicator calculates the average volume for the user selected lookback period. From there a ratio of the current volume vs the average volume is used to determine the candle’s colors.
Plots as colored arrows.
Red = Extreme Demand
Pink = High Demand
Aqua = Average Demand
Yellow = Light Demand
Grey = Dry Demand
版本注释
.版本注释
..开源脚本
秉承TradingView的精神,该脚本的作者将其开源,以便交易者可以查看和验证其功能。向作者致敬!您可以免费使用该脚本,但请记住,重新发布代码须遵守我们的网站规则。
免责声明
这些信息和出版物并非旨在提供,也不构成TradingView提供或认可的任何形式的财务、投资、交易或其他类型的建议或推荐。请阅读使用条款了解更多信息。
免责声明
这些信息和出版物并非旨在提供,也不构成TradingView提供或认可的任何形式的财务、投资、交易或其他类型的建议或推荐。请阅读使用条款了解更多信息。