OPEN-SOURCE SCRIPT
Table: Colorable Timeframes Top-Down Analysis
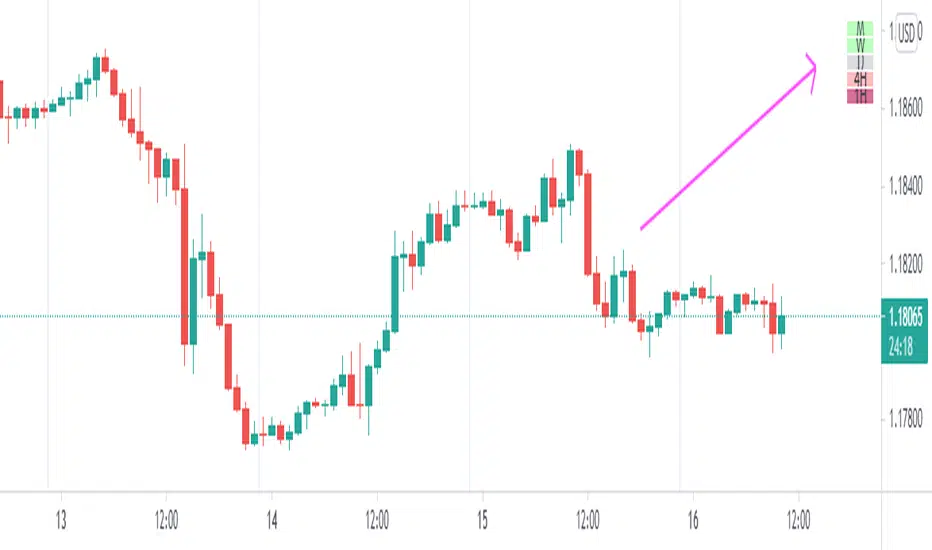
This is a very simple indicator that lets you color up to five different cells. After doing Top-Down analysis, you are probably going to stay on the lowest of timeframes, and if you work with many tickers, you may forget the bigger picture or confuse them.
So you can make some timeframes green if they are bullish or red if they are bearish and you will always have a reminder on the screen in the form of this small non-intrusive table.
So you can make some timeframes green if they are bullish or red if they are bearish and you will always have a reminder on the screen in the form of this small non-intrusive table.
开源脚本
秉承TradingView的精神,该脚本的作者将其开源,以便交易者可以查看和验证其功能。向作者致敬!您可以免费使用该脚本,但请记住,重新发布代码须遵守我们的网站规则。
免责声明
这些信息和出版物并非旨在提供,也不构成TradingView提供或认可的任何形式的财务、投资、交易或其他类型的建议或推荐。请阅读使用条款了解更多信息。
开源脚本
秉承TradingView的精神,该脚本的作者将其开源,以便交易者可以查看和验证其功能。向作者致敬!您可以免费使用该脚本,但请记住,重新发布代码须遵守我们的网站规则。
免责声明
这些信息和出版物并非旨在提供,也不构成TradingView提供或认可的任何形式的财务、投资、交易或其他类型的建议或推荐。请阅读使用条款了解更多信息。