OPEN-SOURCE SCRIPT
RSI Oversold/Overbought Indicator
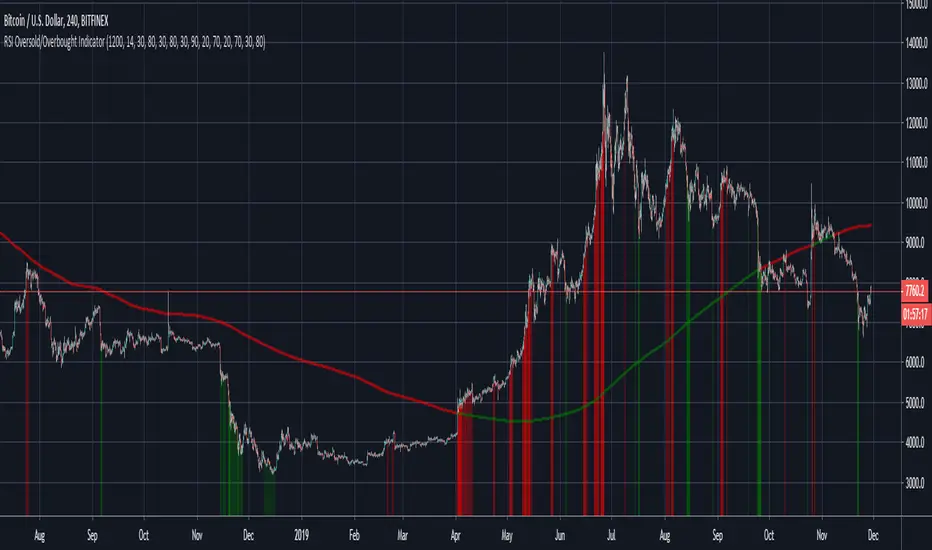
This is a very simple but quite powerful indicator which looks at the RSI simultaneously over the 4h, Daily and Weekly timeframes, and places bands on the chart when one or more timeframes move into oversold/overbought territory. For further filtering I use the 200 day SMA to determine if we are in a Bull or Bear market, which puts a bias on the RSI (30/80 in a Bull market and 20/70 in a Bear market).
The deeper the colour, the more oversold the market is. The weekly RSI can be used as an early warning sign, with the Daily/ 4h RSI useful to identify local peaks.
The deeper the colour, the more oversold the market is. The weekly RSI can be used as an early warning sign, with the Daily/ 4h RSI useful to identify local peaks.
开源脚本
秉承TradingView的精神,该脚本的作者将其开源,以便交易者可以查看和验证其功能。向作者致敬!您可以免费使用该脚本,但请记住,重新发布代码须遵守我们的网站规则。
免责声明
这些信息和出版物并非旨在提供,也不构成TradingView提供或认可的任何形式的财务、投资、交易或其他类型的建议或推荐。请阅读使用条款了解更多信息。
开源脚本
秉承TradingView的精神,该脚本的作者将其开源,以便交易者可以查看和验证其功能。向作者致敬!您可以免费使用该脚本,但请记住,重新发布代码须遵守我们的网站规则。
免责声明
这些信息和出版物并非旨在提供,也不构成TradingView提供或认可的任何形式的财务、投资、交易或其他类型的建议或推荐。请阅读使用条款了解更多信息。