PROTECTED SOURCE SCRIPT
已更新 Equal Highs and Lows - [TEH]
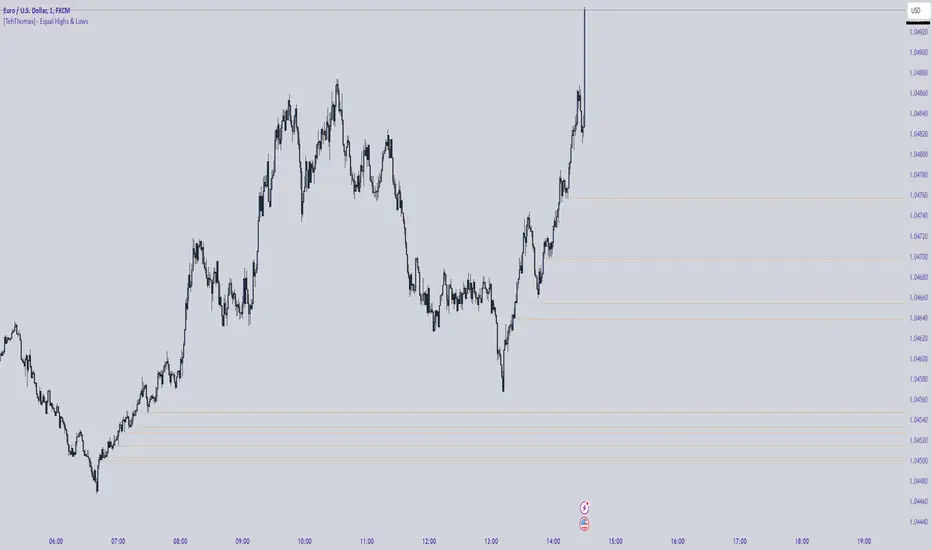
This script is a powerful tool for identifying and visualizing equal highs and lows in the market. It offers traders a way to spot potential support and resistance levels, which can be crucial for making informed trading decisions.
Key Features:
Equal High and Low Detection: The script scans a user-defined lookback period to find price levels where highs or lows are equal to the current bar's high or low.
Customizable Appearance:
Line colors for highs and lows
Line width and style (solid, dashed, or dotted)
Option to extend lines to the right of the chart
Dynamic Line Management:
The script automatically removes lines when price breaches them, keeping the chart clean and relevant.
Text Labels:
Optional text labels can be added to the lines, with customizable text, color, and size.
Functions and Usage:
Main Functions:
findAndDrawEqualHighs(): Identifies equal highs and draws lines connecting them.
findAndDrawEqualLows(): Identifies equal lows and draws lines connecting them.
checkAndRemoveBreachedLines(): Removes lines and labels when price breaks through them.
Analysis Applications:
Support and Resistance Identification: The lines drawn by the script highlight potential support (for lows) and resistance (for highs) levels5.
Trend Analysis: Multiple equal highs or lows can indicate the strength of a trend. Consecutive higher lows might suggest an uptrend, while consecutive lower highs could indicate a downtrend.
Breakout Detection:
When price breaks through a line, it could signal a potential trend change or continuation.
Range Trading:
Identifying equal highs and lows can help traders spot ranging markets and potential boundaries for range-based strategies.
Risk Management:
The lines can be used as reference points for setting stop-loss orders or take-profit targets.
Customization and Flexibility:
The script offers extensive customization options, allowing traders to tailor the indicator to their specific needs and visual preferences. This flexibility makes it suitable for various trading styles and timeframes.
By providing a clear visual representation of equal highs and lows, this script enhances a trader's ability to analyze market structure and make more informed decisions. It's a valuable addition to any trader's toolkit, especially those focusing on technical analysis and price action trading.
版本注释
Changed display name. 版本注释
Changed the chart by accident, fixed now.版本注释
Fixed the issue with the lookback length not working.版本注释
Adjusted some text.受保护脚本
此脚本以闭源形式发布。 但是,您可以自由使用,没有任何限制 — 了解更多信息这里。
🔵 Free Discord Community
bit.ly/TehThomas
🔵 Free Telegram Signals
t.me/codeandcandle
🔵 VIP Elite - Learn how to master the markets
linktr.ee/TehThomas
bit.ly/TehThomas
🔵 Free Telegram Signals
t.me/codeandcandle
🔵 VIP Elite - Learn how to master the markets
linktr.ee/TehThomas
免责声明
这些信息和出版物并非旨在提供,也不构成TradingView提供或认可的任何形式的财务、投资、交易或其他类型的建议或推荐。请阅读使用条款了解更多信息。
受保护脚本
此脚本以闭源形式发布。 但是,您可以自由使用,没有任何限制 — 了解更多信息这里。
🔵 Free Discord Community
bit.ly/TehThomas
🔵 Free Telegram Signals
t.me/codeandcandle
🔵 VIP Elite - Learn how to master the markets
linktr.ee/TehThomas
bit.ly/TehThomas
🔵 Free Telegram Signals
t.me/codeandcandle
🔵 VIP Elite - Learn how to master the markets
linktr.ee/TehThomas
免责声明
这些信息和出版物并非旨在提供,也不构成TradingView提供或认可的任何形式的财务、投资、交易或其他类型的建议或推荐。请阅读使用条款了解更多信息。