OPEN-SOURCE SCRIPT
已更新 Volume Balance Indicator Stealthy7
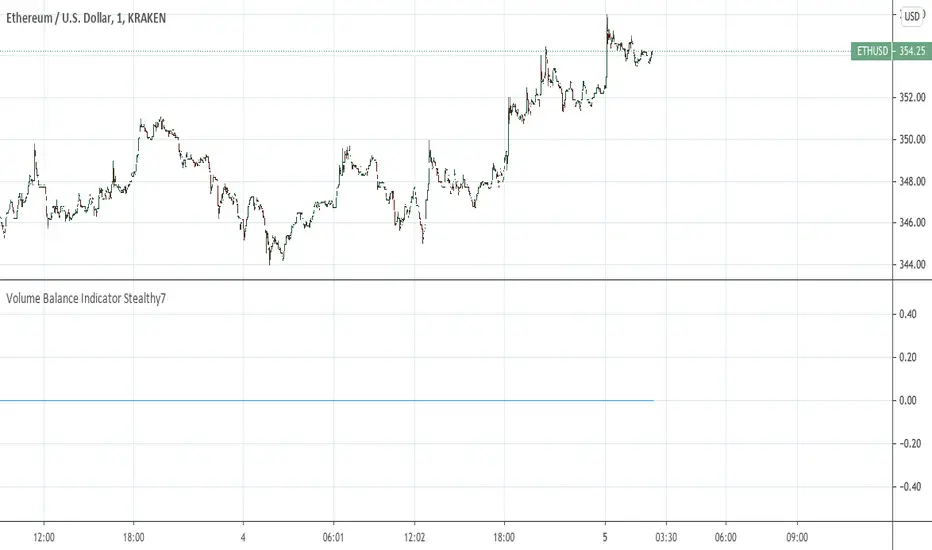
Find out if Bulls (buys) or Bears (sells) are moving the price. This gives a clear view of activity, even if you are using a higher time period. The lookback is in minutes, I believe. This is a superior volume indicator. Bars are recolored to show the underlying activity per the look back (minutes).
版本注释
In this version I fixed the average volume (grey background). If volume eclipses the grey area, its above average by 30 periods.版本注释
Automatic lookback.Bar re-color option.
Wow! Really shows whats going on.
版本注释
I got rid of the old way displayed. This is much more useful and looks totally different.I added Standard deviation bands. Now you know if the volume is really on.
I used a hard coded lookback of 30 because its supposed to be significant (?)
Now you can really see a summary of the underlying minute to minute activity on higher bands.
版本注释
I added a resolution dropdown box and a lookback period. I think this is closer to my original idea. You can view longer periods on a small timeframe. I think you can do vice versa like I originally intended. Not sure, but this is likely final update for this one. I realize now this is like an On Balance Volume indicator with some extras. I think this version is more useful.版本注释
Changed some unnecessary code and default settings.版本注释
Script depreciated. No support.开源脚本
秉承TradingView的精神,该脚本的作者将其开源,以便交易者可以查看和验证其功能。向作者致敬!您可以免费使用该脚本,但请记住,重新发布代码须遵守我们的网站规则。
免责声明
这些信息和出版物并非旨在提供,也不构成TradingView提供或认可的任何形式的财务、投资、交易或其他类型的建议或推荐。请阅读使用条款了解更多信息。
免责声明
这些信息和出版物并非旨在提供,也不构成TradingView提供或认可的任何形式的财务、投资、交易或其他类型的建议或推荐。请阅读使用条款了解更多信息。