OPEN-SOURCE SCRIPT
已更新 Change% by Amit
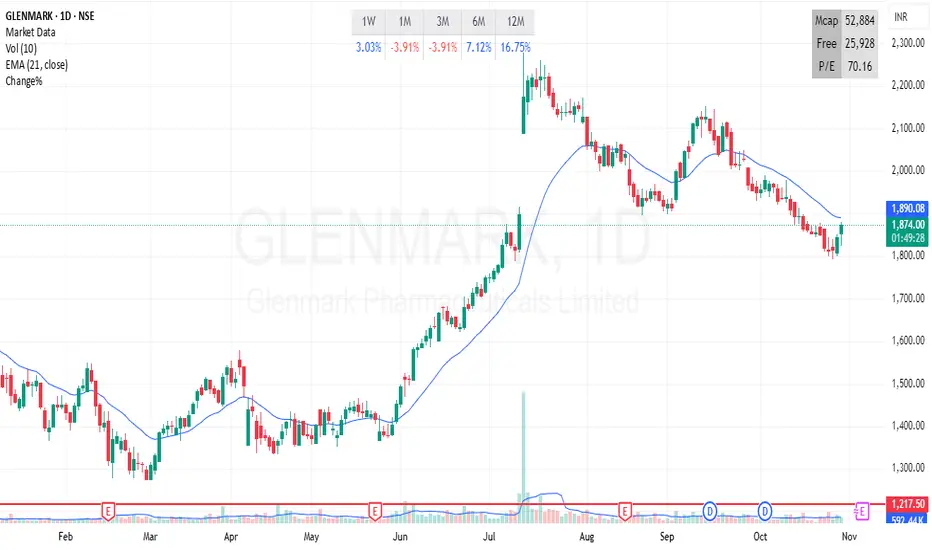
Multi-Period Returns Table
This indicator displays percentage returns across multiple timeframes —
1 Week,
1 Month,
3 Months,
6 Months,
12 Months.
This helps traders quickly assess short-term and long-term performance trends.
Positive returns are highlighted in blue, while negative returns are shown in red, allowing instant visual recognition of strength or weakness.
Ideal for spotting momentum shifts, relative performance, and trend consistency across different horizons.
版本注释
Updated version版本注释
Version 3开源脚本
本着TradingView的真正精神,此脚本的创建者将其开源,以便交易者可以查看和验证其功能。向作者致敬!虽然您可以免费使用它,但请记住,重新发布代码必须遵守我们的网站规则。
免责声明
这些信息和出版物并不意味着也不构成TradingView提供或认可的金融、投资、交易或其它类型的建议或背书。请在使用条款阅读更多信息。
开源脚本
本着TradingView的真正精神,此脚本的创建者将其开源,以便交易者可以查看和验证其功能。向作者致敬!虽然您可以免费使用它,但请记住,重新发布代码必须遵守我们的网站规则。
免责声明
这些信息和出版物并不意味着也不构成TradingView提供或认可的金融、投资、交易或其它类型的建议或背书。请在使用条款阅读更多信息。