OPEN-SOURCE SCRIPT
已更新 Volume Buzz 2.0
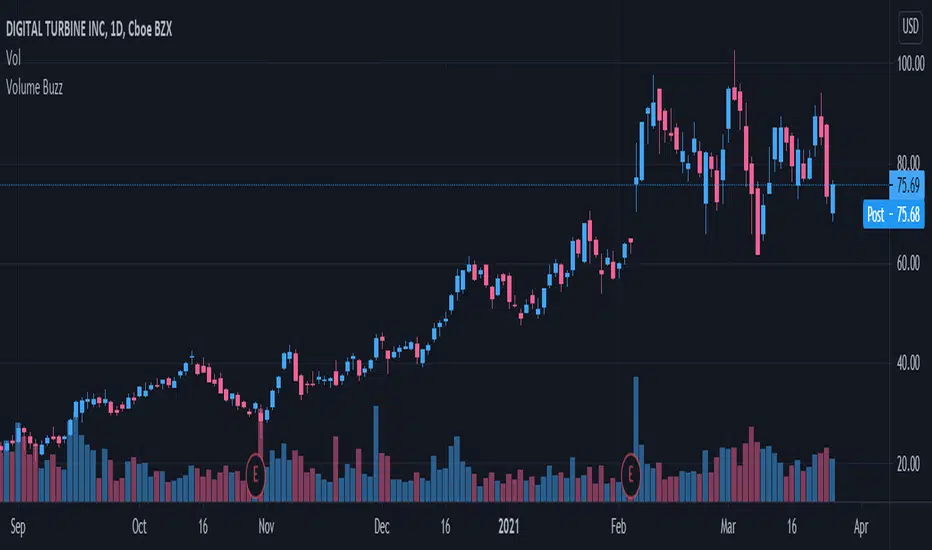
Volume Buzz/Volume Run Rate as seen on TC2000 and MarketSmith respectively.
Basically, the volume buzz tells you what percentage over average(100 time period moving average) the volume traded was. You can use this indicator to more readily identify above-average trading volume and accumulation days on charts. The percentage will show up in the top left corner, make sure to click the settings button and uncheck the second box(left of plot) in order to get rid of the chart line.
Pictured above, a chart with the volume on the bottom along with the 50-day moving average applied to volume. As you can see in the top left it will tell you the "volume buzz" of that day, telling you what days were on above-average volume and how above-average those days were.
版本注释
No longer need to disable plot!开源脚本
秉承TradingView的精神,该脚本的作者将其开源,以便交易者可以查看和验证其功能。向作者致敬!您可以免费使用该脚本,但请记住,重新发布代码须遵守我们的网站规则。
免责声明
这些信息和出版物并非旨在提供,也不构成TradingView提供或认可的任何形式的财务、投资、交易或其他类型的建议或推荐。请阅读使用条款了解更多信息。
开源脚本
秉承TradingView的精神,该脚本的作者将其开源,以便交易者可以查看和验证其功能。向作者致敬!您可以免费使用该脚本,但请记住,重新发布代码须遵守我们的网站规则。
免责声明
这些信息和出版物并非旨在提供,也不构成TradingView提供或认可的任何形式的财务、投资、交易或其他类型的建议或推荐。请阅读使用条款了解更多信息。