PROTECTED SOURCE SCRIPT
已更新 My new BTC log curve
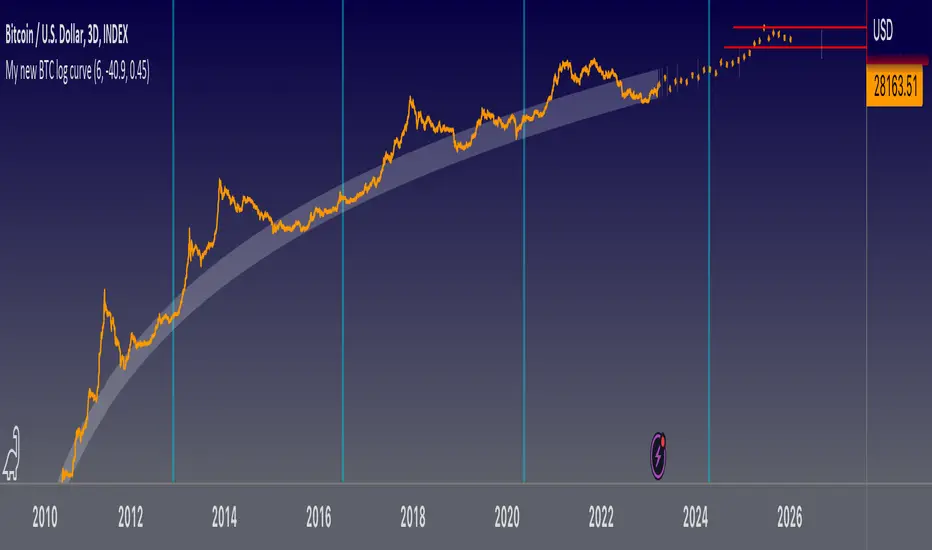
This is my new logarithmic regression curve to the USD/BTC price chart. It is based on a new, very simple equation: y = (e^b)*(x^a), where x is number of days since the Genesis block, a and b are parameters set by the user. Also included is an upper regression curve that is fit to the peaks of each Bitcoin cycle; no fundamental analysis went into making these lines, they are merely fits to the data, so it should not be expected that they can be used to predict tops and bottoms. The upper regression curve is the product of the support curve (lower curve) and two other factors: a constant, and an exponential decay. The constant and the decay factors are parameters that can be set by the user.
版本注释
Fixed top curve; prior version had top curve equal to the support price multiplied by an exponential decay curve which would cause the top curve to eventually fall below support curve and asymptotically approach zero. This version makes the top curve equal to the price multiplied by a constant plus exponential decay curve, so the top curve will always be above the support curve with some margin.Also, the top curve is now a top band, with a thickness (height) that can be changed by the user.
版本注释
Updated the default values. Removed top curve. Added some extrapolation of the support curve on 3-day and weekly charts.版本注释
Fixed script chart.受保护脚本
此脚本以闭源形式发布。 但是,您可以自由使用,没有任何限制 — 了解更多信息这里。
免责声明
这些信息和出版物并非旨在提供,也不构成TradingView提供或认可的任何形式的财务、投资、交易或其他类型的建议或推荐。请阅读使用条款了解更多信息。
受保护脚本
此脚本以闭源形式发布。 但是,您可以自由使用,没有任何限制 — 了解更多信息这里。
免责声明
这些信息和出版物并非旨在提供,也不构成TradingView提供或认可的任何形式的财务、投资、交易或其他类型的建议或推荐。请阅读使用条款了解更多信息。