OPEN-SOURCE SCRIPT
已更新 Hindenburg Omen [QuantNomad]
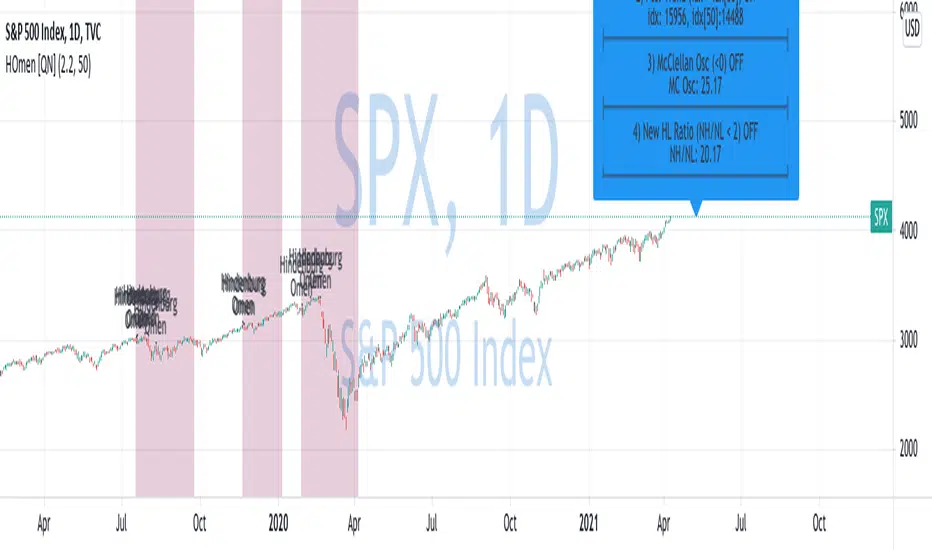
New record highs is good time to look at a market crash indicators )
This is a Hindenburg Omen indicator.
The Hindenburg Omen looks for a statistical deviation from the premise that under normal conditions, securities are either making new 52-week highs or 52-week lows. The abnormality would be if both were occurring at the same time. According to the Hindenburg Omen, an occurrence such as this is considered to be a harbinger of impending danger for a stock market. The signal typically occurs during an uptrend, where new highs are expected and new lows are rare, suggesting that the market is becoming nervous and indecisive, traits that often lead to a bear market.
For it to be on 4 conditions should be satisfied:
1. Number of new 52-week highs and 52-week lows in a stock market are greater than a threshold (2.2% for example).
2. Positive recent trend. Index > index[50]
3. The McClellan Oscillator (MCO) is negative.
4. 52-week highs cannot be more than two times the 52-week lows.
You can read more about the indicator on Investopedia:
investopedia.com/terms/h/hindenburgomen.asp
Based on indicator created by Boombotcom:
版本注释
I fixed data sources for indicator. Thanks to Marcus for providing me info on new sources. 开源脚本
秉承TradingView的精神,该脚本的作者将其开源,以便交易者可以查看和验证其功能。向作者致敬!您可以免费使用该脚本,但请记住,重新发布代码须遵守我们的网站规则。
💻 Online Courses and Access to PRO Indicators in the QuanTribe community: qntly.com/qt
💼 Hire Us: qntly.com/pine
📞 Book a call: qntly.com/cons
📰 qntly.com/news
𝕏: qntly.com/x
📩 qntly.com/tel
💼 Hire Us: qntly.com/pine
📞 Book a call: qntly.com/cons
📰 qntly.com/news
𝕏: qntly.com/x
📩 qntly.com/tel
免责声明
这些信息和出版物并非旨在提供,也不构成TradingView提供或认可的任何形式的财务、投资、交易或其他类型的建议或推荐。请阅读使用条款了解更多信息。
开源脚本
秉承TradingView的精神,该脚本的作者将其开源,以便交易者可以查看和验证其功能。向作者致敬!您可以免费使用该脚本,但请记住,重新发布代码须遵守我们的网站规则。
💻 Online Courses and Access to PRO Indicators in the QuanTribe community: qntly.com/qt
💼 Hire Us: qntly.com/pine
📞 Book a call: qntly.com/cons
📰 qntly.com/news
𝕏: qntly.com/x
📩 qntly.com/tel
💼 Hire Us: qntly.com/pine
📞 Book a call: qntly.com/cons
📰 qntly.com/news
𝕏: qntly.com/x
📩 qntly.com/tel
免责声明
这些信息和出版物并非旨在提供,也不构成TradingView提供或认可的任何形式的财务、投资、交易或其他类型的建议或推荐。请阅读使用条款了解更多信息。