OPEN-SOURCE SCRIPT
Rate of Change w/ Butterworth Filter
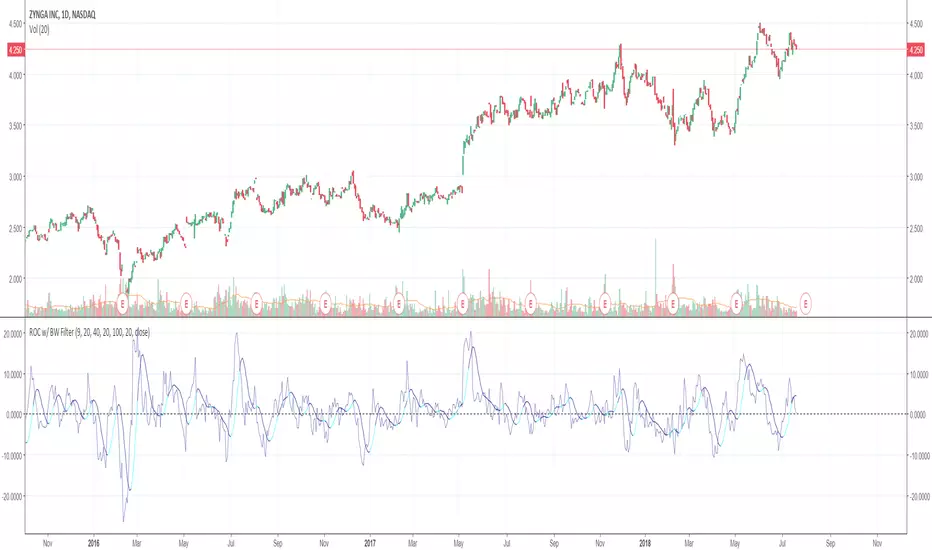
It passes the Rate of Change data through a Butterworth filter which creates a smooth line that can allow for easier detection of slope changes in the data over various periods of times.
The butterworth filter line and the rate of change are plotted together by default. The values for the lengths, for both the butterworth filter and the raw ROC data, can be changed from the format menu (through a toggle).
The shorter the Butterworth length, the closer the line is fitted to the raw ROC data, however you trade of with more frequent slope changes.
The longer the Butterworth length, the smoother the line and less frequent the slope changes, but the Butterworth line is farther of center from the raw ROC data.
开源脚本
秉承TradingView的精神,该脚本的作者将其开源,以便交易者可以查看和验证其功能。向作者致敬!您可以免费使用该脚本,但请记住,重新发布代码须遵守我们的网站规则。
免责声明
这些信息和出版物并非旨在提供,也不构成TradingView提供或认可的任何形式的财务、投资、交易或其他类型的建议或推荐。请阅读使用条款了解更多信息。
开源脚本
秉承TradingView的精神,该脚本的作者将其开源,以便交易者可以查看和验证其功能。向作者致敬!您可以免费使用该脚本,但请记住,重新发布代码须遵守我们的网站规则。
免责声明
这些信息和出版物并非旨在提供,也不构成TradingView提供或认可的任何形式的财务、投资、交易或其他类型的建议或推荐。请阅读使用条款了解更多信息。