PROTECTED SOURCE SCRIPT
filbfilbs Better OBV
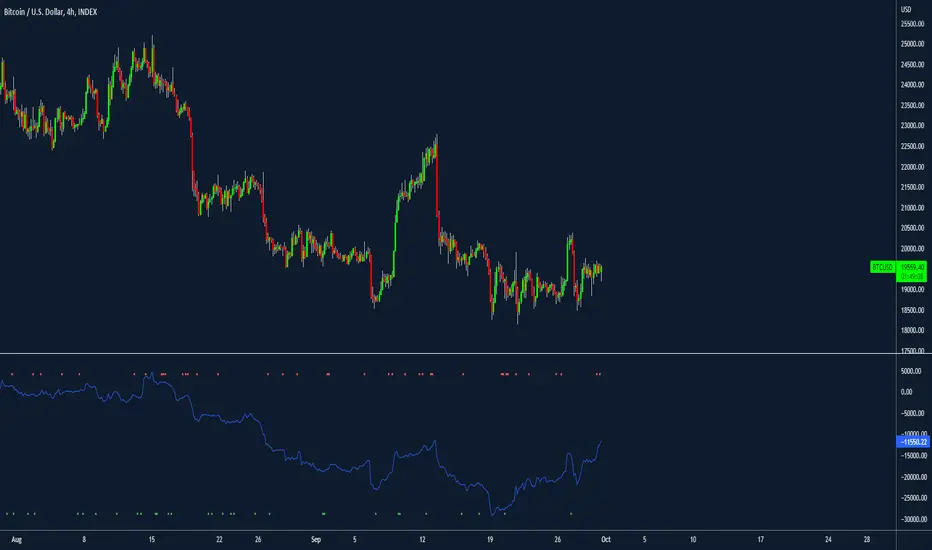
This indicator looks at the delta on the buying and selling volume of customizable lower timeframes to the timeframe selected and cumulates the delta between the buying and selling of those candles.
For example on a 4-hour chart, it will look at the 1 min timeframes and consider the delta by LTF candle, ranter than the summised view on the 4-hour.
In essence, it is trying to replicate CVD using time and price data without the order book, it becomes a "better, lower timeframe based, customizable OBV"
It also prints divergence as squares above or below the chart, where, for example, there would be buying on LTFs but the HTF candle closes red, this would be shown as bearish divergence.
Credit to Trading view and their up / down indicator, which this is a derivative of.
Any questions please ask!
受保护脚本
此脚本以闭源形式发布。 但是,您可以自由使用,没有任何限制 — 了解更多信息这里。
免责声明
这些信息和出版物并非旨在提供,也不构成TradingView提供或认可的任何形式的财务、投资、交易或其他类型的建议或推荐。请阅读使用条款了解更多信息。
免责声明
这些信息和出版物并非旨在提供,也不构成TradingView提供或认可的任何形式的财务、投资、交易或其他类型的建议或推荐。请阅读使用条款了解更多信息。