PROTECTED SOURCE SCRIPT
已更新 soRSIs - Stochastic RSI versus RSI Group
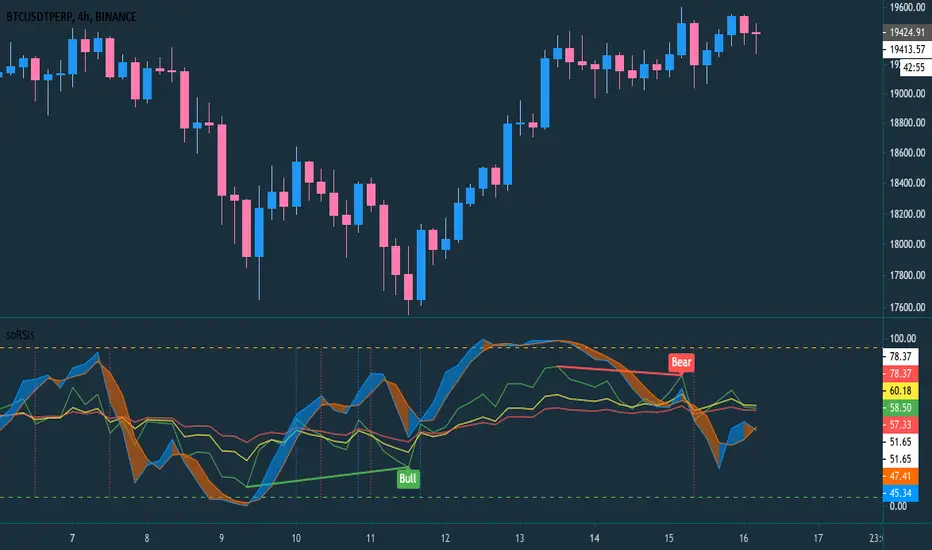
soRSIs is about collaboration between Stochastic Relative Strength Index (SRSI) with Relative Strength Index (RSI) Group
RSI Group is group from three RSI, by default is 6,14, and 25
How to read:
It works in all time frames, but please keep in mind, higher timeframe can have stronger confirmation and trend.
The indicator settings:
*Show Crossed RSI: default is true, it will show vertical line if RSI1 crossed under/over the RSI2 and RSI3
*Source: default value is close, it is the resource when and where data are taken
*RSI1: default value is 6, but user can change any value
*RSI2: default value is 14, but user can change any value
*RSI1: default value is 25, but user can change any value
*Overbought: default value is 95, it is horizontal line on the top that indicates over bought or strength index fullness
*Overbought: default value is 5, it is horizontal line on the top that indicates over sold or strength index weakness
*The rest settings are about Stochastic RSI
RSI Group is group from three RSI, by default is 6,14, and 25
How to read:
- If SRSI crossed over RSI Group, it can indicate an uptrend confirmation
- If SRSI crossed under RSI Group, it can indicate a downtrend confirmation
- If SRSI rejected to cross under RSI Group, it can indicate a correction recovery
- If SRSI rejected to cross over RSI Group, it can indicate continuity correction
- If RSI group perform descending 25,14,6, it can indicate bearish
- If RSI group perform ascending 6,14,25, it can indicate bullish
- If RSI group or SRSI reaches overbought line, it can indicate warning for LONG and good for SHORT
- If RSI group or SRSI reaches oversold line, it can indicate warning for SHORT and good for LONG
It works in all time frames, but please keep in mind, higher timeframe can have stronger confirmation and trend.
The indicator settings:
*Show Crossed RSI: default is true, it will show vertical line if RSI1 crossed under/over the RSI2 and RSI3
*Source: default value is close, it is the resource when and where data are taken
*RSI1: default value is 6, but user can change any value
*RSI2: default value is 14, but user can change any value
*RSI1: default value is 25, but user can change any value
*Overbought: default value is 95, it is horizontal line on the top that indicates over bought or strength index fullness
*Overbought: default value is 5, it is horizontal line on the top that indicates over sold or strength index weakness
*The rest settings are about Stochastic RSI
版本注释
Added divergence受保护脚本
此脚本以闭源形式发布。 但是,您可以自由使用,没有任何限制 — 了解更多信息这里。
免责声明
这些信息和出版物并非旨在提供,也不构成TradingView提供或认可的任何形式的财务、投资、交易或其他类型的建议或推荐。请阅读使用条款了解更多信息。
受保护脚本
此脚本以闭源形式发布。 但是,您可以自由使用,没有任何限制 — 了解更多信息这里。
免责声明
这些信息和出版物并非旨在提供,也不构成TradingView提供或认可的任何形式的财务、投资、交易或其他类型的建议或推荐。请阅读使用条款了解更多信息。