INVITE-ONLY SCRIPT
Flag Breakout Bullish Daily TF by SidHem
Flag Breakout Bullish Daily TF by SidHem
Overview:
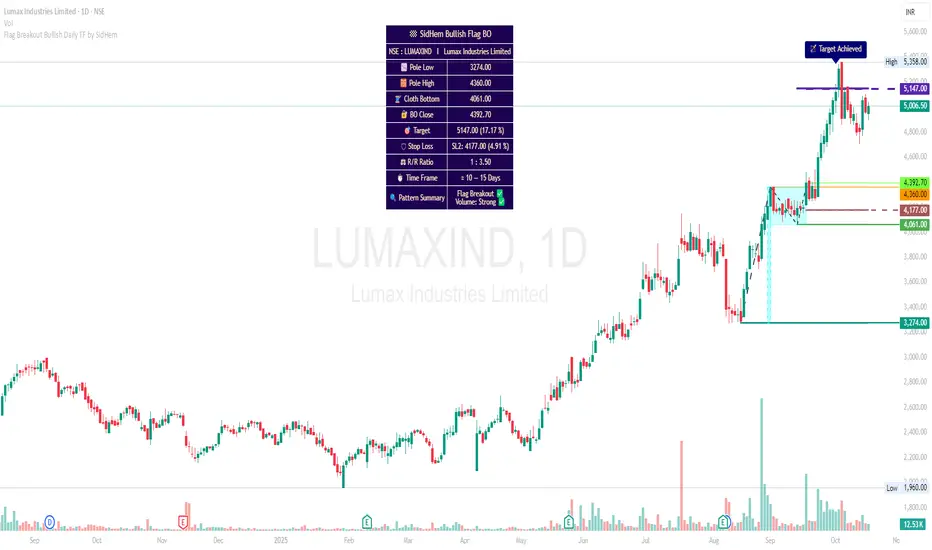
This indicator helps analyze Bullish Flag Breakouts (Rectangle) on the Daily Time Frame, providing a clear visual and tabular summary of key levels, stop-loss zones, expected pattern target and metrics. Traders can quickly assess breakout validity, risk/reward, and target achievement without manual calculations.
Please Note:
Flags are not auto-detected. Traders input four key dates: Pole start, Pole high, Cloth bottom, and Breakout candle. The indicator then calculates and plots all essential levels—including Pole, Cloth, Breakout Open/Close/Mean, Stop Loss, and Expected Pattern Target prices. This allows users who understand flag patterns but are unsure how to calculate targets or SL to efficiently work with the pattern.
Features:
Visualization: Highlights Pole, Cloth, and Breakout candles with horizontal rays, optional diagonal Pole lines, V-Arms, and filled boxes for clarity.
Dynamic Table Summary:
Displays symbol, Pole Low/High, Cloth Bottom, Breakout Open/Close/Mean, Expected Pattern Target, Stop Loss (3 methods, preferably on closing basis), Pole Height, Risk/Reward Ratio, Bars to Breakout, Estimated Time Frame, Pattern Summary, Flag Breakout status, and Volume strength.
Target & SL Labels: Plots target and SL lines on the chart with Expected Pattern Target, Target Achieved, and SL labels.
Customizable Appearance: Adjustable table rows, label sizes, colors, styles, widths, and transparency.
Purpose:
Accurately analyzes Bullish Flag Breakouts by entering only the four required dates; all plotting, calculation, and table generation are automated.
Overview:
This indicator helps analyze Bullish Flag Breakouts (Rectangle) on the Daily Time Frame, providing a clear visual and tabular summary of key levels, stop-loss zones, expected pattern target and metrics. Traders can quickly assess breakout validity, risk/reward, and target achievement without manual calculations.
Please Note:
Flags are not auto-detected. Traders input four key dates: Pole start, Pole high, Cloth bottom, and Breakout candle. The indicator then calculates and plots all essential levels—including Pole, Cloth, Breakout Open/Close/Mean, Stop Loss, and Expected Pattern Target prices. This allows users who understand flag patterns but are unsure how to calculate targets or SL to efficiently work with the pattern.
Features:
Visualization: Highlights Pole, Cloth, and Breakout candles with horizontal rays, optional diagonal Pole lines, V-Arms, and filled boxes for clarity.
Dynamic Table Summary:
Displays symbol, Pole Low/High, Cloth Bottom, Breakout Open/Close/Mean, Expected Pattern Target, Stop Loss (3 methods, preferably on closing basis), Pole Height, Risk/Reward Ratio, Bars to Breakout, Estimated Time Frame, Pattern Summary, Flag Breakout status, and Volume strength.
Target & SL Labels: Plots target and SL lines on the chart with Expected Pattern Target, Target Achieved, and SL labels.
Customizable Appearance: Adjustable table rows, label sizes, colors, styles, widths, and transparency.
Purpose:
Accurately analyzes Bullish Flag Breakouts by entering only the four required dates; all plotting, calculation, and table generation are automated.
仅限邀请脚本
只有作者授权的用户才能访问此脚本。您需要申请并获得使用许可。通常情况下,付款后即可获得许可。更多详情,请按照下方作者的说明操作,或直接联系sidhem。
TradingView不建议您付费购买或使用任何脚本,除非您完全信任其作者并了解其工作原理。您也可以在我们的社区脚本找到免费的开源替代方案。
作者的说明
To request access, click the Request Access button on this page or contact the author directly via TradingView private message. Access requests are reviewed within 24–48 hours. Please do not use the Comments section to request access.
免责声明
这些信息和出版物并非旨在提供,也不构成TradingView提供或认可的任何形式的财务、投资、交易或其他类型的建议或推荐。请阅读使用条款了解更多信息。