OPEN-SOURCE SCRIPT
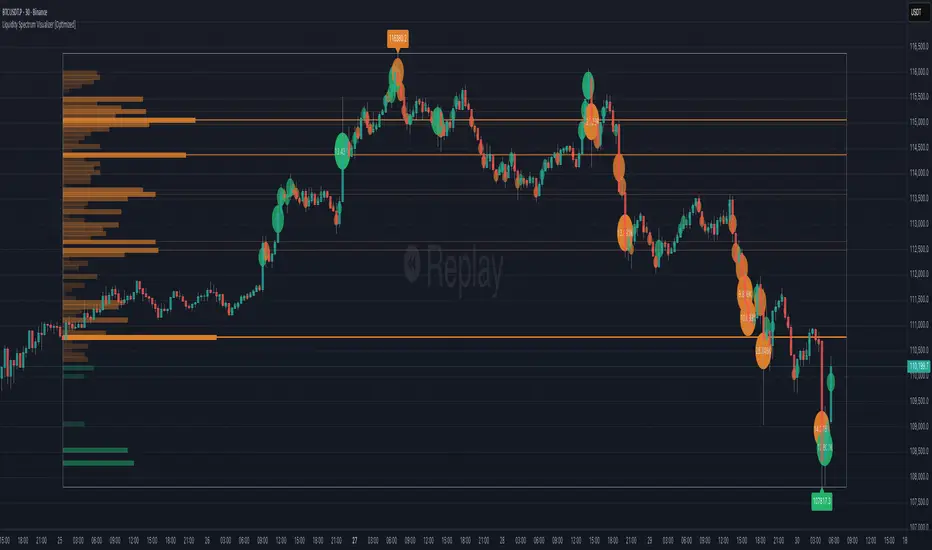
Liquidity Spectrum Visualizer BigBeluga - optimized by nguyenthl
This optimized version of the original Liquidity Spectrum Visualizer is designed for traders who want the same analytical output as the original indicator, but with significantly faster execution and smoother performance.
The script preserves the original visualization and logic — it still maps volume activity across price bins to highlight liquidity clusters — but the internal calculations have been carefully restructured to reduce computational load and improve responsiveness on live charts.
What’s new and why it matters
Single-pass binning algorithm: Each bar is processed once, reducing loop complexity from O(N×M) to O(N). This allows the indicator to run fluidly on higher timeframes and large datasets.
Precomputed min/max levels: Eliminates redundant array scans, improving efficiency for real-time analysis.
Minimal label usage: Only key high/low markers are drawn, removing visual clutter and improving chart readability.
Optimized resource handling: Boxes and lines are refreshed as a group, minimizing redraw lag.
Why this is useful
This version is particularly helpful for traders using complex layouts, slower machines, or multi-chart setups. It offers the same analytical insight into liquidity zones while keeping chart performance stable and responsive.
How to use it
Apply the indicator as you would the original version. It visualizes liquidity distributions, helping identify areas of concentrated activity or potential support/resistance zones.
The script includes optional features such as gradient rendering and POC (Point of Control) highlighting, which can be toggled on or off for clarity.
Notes
The purpose of this version is purely performance optimization — analytical integrity is fully preserved.
The chart example provided focuses solely on this indicator, with no additional overlays, so users can clearly see its visual output.
开源脚本
本着TradingView的真正精神,此脚本的创建者将其开源,以便交易者可以查看和验证其功能。向作者致敬!虽然您可以免费使用它,但请记住,重新发布代码必须遵守我们的网站规则。
Contact me in PM or on Telegram: @nguyenthl
免责声明
这些信息和出版物并不意味着也不构成TradingView提供或认可的金融、投资、交易或其它类型的建议或背书。请在使用条款阅读更多信息。
开源脚本
本着TradingView的真正精神,此脚本的创建者将其开源,以便交易者可以查看和验证其功能。向作者致敬!虽然您可以免费使用它,但请记住,重新发布代码必须遵守我们的网站规则。
Contact me in PM or on Telegram: @nguyenthl
免责声明
这些信息和出版物并不意味着也不构成TradingView提供或认可的金融、投资、交易或其它类型的建议或背书。请在使用条款阅读更多信息。