INVITE-ONLY SCRIPT
已更新 AUTO Demand & Supply Strategy
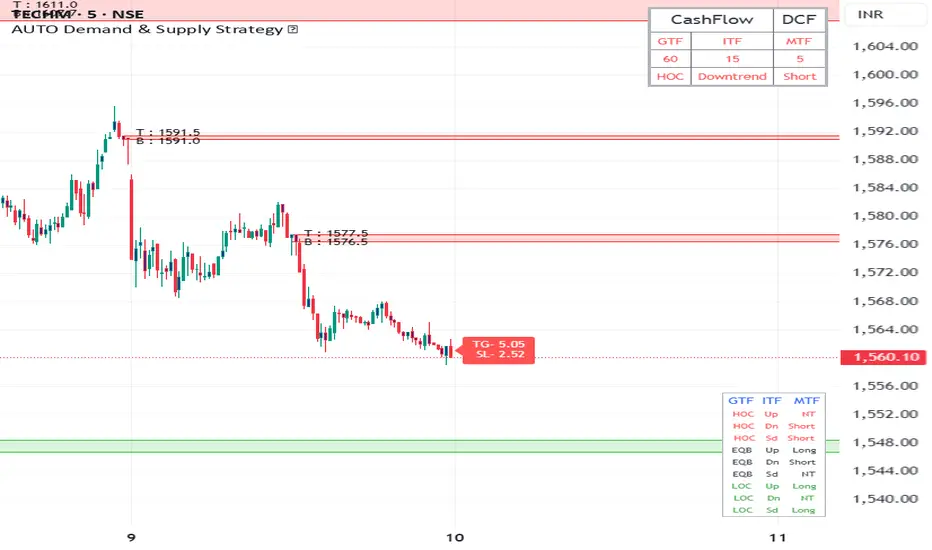
* This Indicator is based on Demand and Supply Zone Strategy.
How does this Indicator Works ?
How does this Indicator Works ?
- 1. This Indicator Provides Option to choose the Cashflow type, which you wanted to trade in next session, like Daily Cashflow, Weekly Cashflow, Monthly Cashflow, Quarterly Cashflow, so that Indicator does not mess in other timeframes except chosen cashflow, so chart looks clean.
- 2. This Indicator will Automatically Identifies Demand & Supply Zones based on Price Action in Lower time frame and higher timeframes and Plot them on chart, with option to show the Entry Price of the zone. you can Change the color, thickness and background color of the Zones.
- 3. This Indicator also shows Demand & Supply Zones which are Tested Today, which means price touches the previous Demand & Supply zones today . indicator gives option to hide tested zone and their price.
- 4. Indicator will automatically plots vertical and horizontal line over 50days MA to Indicates Trend in Intermediate Timeframe(ITF) of the chosen cashflow. you can change the color and thickness of the line
- 5. Indicator will Automatically Calculate ATR multiplier Stop-loss and Target in Minor Time Frame of Chosen Cashflow, Indicator gives option choose ATR multiplied value and Target Ratio, You have to consider this Stop-loss & Target value only when the candle retest(touches) the zone.
- 6. Automatically Draws Demand and Supply zones of overnight Gaps. Indicator shows Entry Price of Proximal Line of zones, which can be turned off in the settings .
- 8. Indicator shows Warning in other timeframe except chosen Cashflow type to chose the proper time frame, also show warning if zones Plotting is off.
- 9. This Indicator shows information table on right side of the chart about the chosen Cashflow Type, Trend in ITF and Entry Decisions according to conditions .
版本注释
Minimal Optimization.版本注释
Minimal Optimization版本注释
- Optimized Overall Performance
版本注释
- Tested Zones Error Removed
版本注释
- Improved Script Loading Speed
版本注释
Settings Updated版本注释
Error fixed & Optimized Overall Performance.版本注释
VERSION 2.0 NEW FEATURES ADDED WITH MAJOR ERROR REMOVED & IMPROVED OVERALL PERFORMANCE,
- Now Curve Analysis For Higher Timeframe Will Drawn Automatically, and directly Visible from lower Timeframes
- Tested Zones Can be Extend or Cutsoff upto the Piercing Candle
- Signal Indication Table updated with Multi Timeframe Analysis At One place, Indicates Curve Analysis From Higher Tiemframe , Trend Analysis From Intermediate Timeframe and Trade Signal at Loweer Timeframe
- Lable Color of ATR Target & Stoploss is Basedd on Signal Color.
- Missing Zones For Overnight GAPS are Updated
版本注释
Improved Overall Performance仅限邀请脚本
只有作者授权的用户才能访问此脚本。您需要申请并获得使用许可。通常情况下,付款后即可获得许可。更多详情,请按照下方作者的说明操作,或直接联系Bharatgawande12。
TradingView不建议您付费购买或使用任何脚本,除非您完全信任其作者并了解其工作原理。您也可以在我们的社区脚本找到免费的开源替代方案。
作者的说明
This is Subscription based Indicator, You have to get Subscription to Access it from https://atropine.in
免责声明
这些信息和出版物并非旨在提供,也不构成TradingView提供或认可的任何形式的财务、投资、交易或其他类型的建议或推荐。请阅读使用条款了解更多信息。
仅限邀请脚本
只有作者授权的用户才能访问此脚本。您需要申请并获得使用许可。通常情况下,付款后即可获得许可。更多详情,请按照下方作者的说明操作,或直接联系Bharatgawande12。
TradingView不建议您付费购买或使用任何脚本,除非您完全信任其作者并了解其工作原理。您也可以在我们的社区脚本找到免费的开源替代方案。
作者的说明
This is Subscription based Indicator, You have to get Subscription to Access it from https://atropine.in
免责声明
这些信息和出版物并非旨在提供,也不构成TradingView提供或认可的任何形式的财务、投资、交易或其他类型的建议或推荐。请阅读使用条款了解更多信息。