PROTECTED SOURCE SCRIPT
1H / 1D / 1W Çoklu Zaman Ölçekli Destek–Direnç (Reg Kanal Özeti)
Multi-Timeframe Regression Channel — Support & Resistance Map
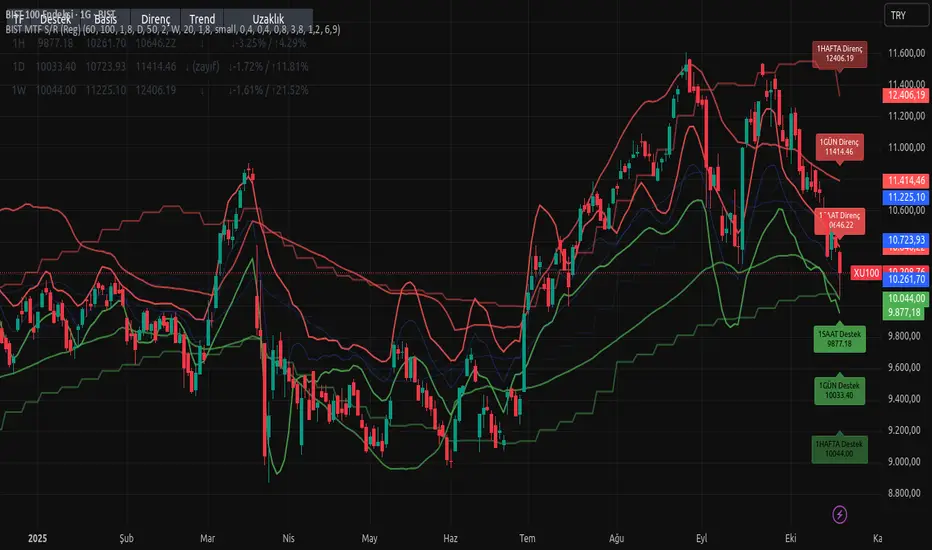
This indicator automatically plots regression-based support and resistance levels for three major timeframes — 1H (short-term traders), 1D (swing traders), and 1W (long-term investors) — all displayed on the same chart.
It combines linear regression channels and standard deviation offsets to reveal the active trend and volatility structure across multiple time horizons.
Each timeframe includes:
Upper band (Resistance) — potential selling or overextension zone
Basis line (Regression mean) — fair-value trend midpoint
Lower band (Support) — potential accumulation or reaction zone
A summary table in the top-left corner shows current levels, slope direction (↑ / ↓ / →), RSI-based strength notes, and percentage distances to each band.
All levels auto-update with the latest data, regardless of the chart timeframe.
Ideal for:
Multi-timeframe confluence analysis
Swing trading setups and breakout confirmations
Trend-following or mean-reversion strategies
✅ Tip:
When price holds above the lower band, the structure remains bullish.
A clean break above resistance often signals momentum continuation, while a close below support can mark a trend weakening.
受保护脚本
此脚本以闭源形式发布。 但是,您可以自由使用它,没有任何限制 — 在此处了解更多信息。
免责声明
这些信息和出版物并不意味着也不构成TradingView提供或认可的金融、投资、交易或其它类型的建议或背书。请在使用条款阅读更多信息。
免责声明
这些信息和出版物并不意味着也不构成TradingView提供或认可的金融、投资、交易或其它类型的建议或背书。请在使用条款阅读更多信息。