OPEN-SOURCE SCRIPT
Adaptive RSI Strategy
The Adaptive RSI Strategy is designed to give you an edge by adapting to changing market conditions more effectively than the traditional RSI. By adjusting dynamically to recent price movements, this strategy aims to provide more timely and accurate trade signals.
How Does It Work?
You can set the number of periods for the RSI calculation. The default is 14, but feel free to experiment with different lengths to suit your trading style.
Choose the price data to base the RSI on, typically the closing price.
Decide if you want the strategy to visually highlight upward and downward movements of the Adaptive RSI (ARSI) on the chart. This can help you quickly spot trends.
Adaptive Calculation:
Alpha: The strategy uses an adaptive factor called alpha, which changes based on recent RSI values. This makes the RSI more sensitive to recent market conditions.
Adaptive RSI (ARSI): This is the core of our strategy. It calculates the ARSI using the adaptive alpha, making it more responsive to price changes compared to the traditional RSI.
Trade Signals:
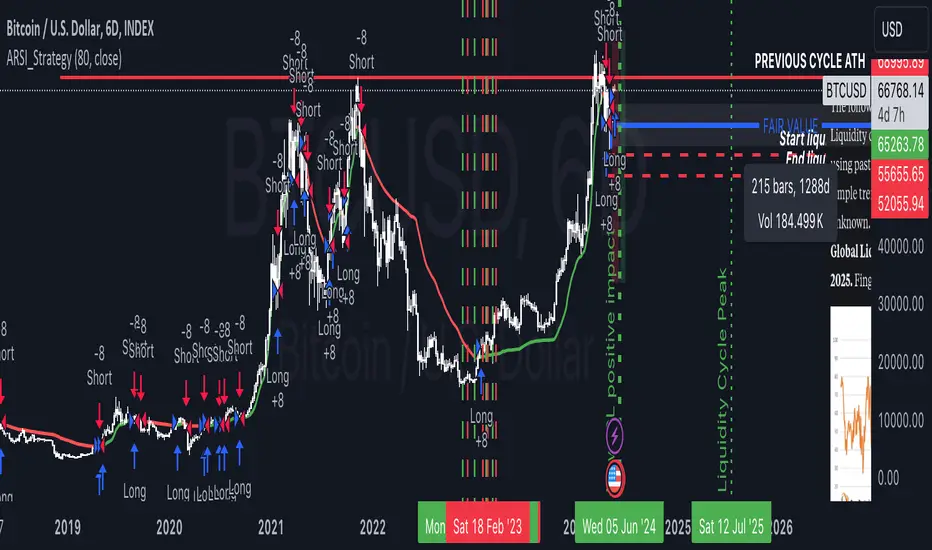
Long Entry (Buy Signal): The strategy triggers a buy signal when the ARSI value crosses above its previous value. This indicates a potential upward trend, suggesting it's a good time to enter a long position.
Short Entry (Sell Signal): Conversely, a sell signal is triggered when the ARSI value crosses below its previous value, indicating a potential downward trend and suggesting it's a good time to enter a short position.
Visual Representation:
If you enable the highlight movements feature, the ARSI line on the chart will change color: green for upward movements and red for downward movements. This makes it easier to see potential trade opportunities at a glance.
Why Use the Adaptive RSI Strategy?
Responsiveness: The adaptive nature of this strategy means it's more sensitive to market changes, helping you react quicker to new trends.
Customization: You can tailor the length of the RSI period and decide whether to highlight movements, allowing you to adapt the strategy to your specific needs and preferences.
Visual Clarity: Highlighting the ARSI movements on the chart makes it easier to spot trends and potential entry points, giving you a clearer picture of the market.
How Does It Work?
You can set the number of periods for the RSI calculation. The default is 14, but feel free to experiment with different lengths to suit your trading style.
Choose the price data to base the RSI on, typically the closing price.
Decide if you want the strategy to visually highlight upward and downward movements of the Adaptive RSI (ARSI) on the chart. This can help you quickly spot trends.
Adaptive Calculation:
Alpha: The strategy uses an adaptive factor called alpha, which changes based on recent RSI values. This makes the RSI more sensitive to recent market conditions.
Adaptive RSI (ARSI): This is the core of our strategy. It calculates the ARSI using the adaptive alpha, making it more responsive to price changes compared to the traditional RSI.
Trade Signals:
Long Entry (Buy Signal): The strategy triggers a buy signal when the ARSI value crosses above its previous value. This indicates a potential upward trend, suggesting it's a good time to enter a long position.
Short Entry (Sell Signal): Conversely, a sell signal is triggered when the ARSI value crosses below its previous value, indicating a potential downward trend and suggesting it's a good time to enter a short position.
Visual Representation:
If you enable the highlight movements feature, the ARSI line on the chart will change color: green for upward movements and red for downward movements. This makes it easier to see potential trade opportunities at a glance.
Why Use the Adaptive RSI Strategy?
Responsiveness: The adaptive nature of this strategy means it's more sensitive to market changes, helping you react quicker to new trends.
Customization: You can tailor the length of the RSI period and decide whether to highlight movements, allowing you to adapt the strategy to your specific needs and preferences.
Visual Clarity: Highlighting the ARSI movements on the chart makes it easier to spot trends and potential entry points, giving you a clearer picture of the market.
开源脚本
秉承TradingView的精神,该脚本的作者将其开源,以便交易者可以查看和验证其功能。向作者致敬!您可以免费使用该脚本,但请记住,重新发布代码须遵守我们的网站规则。
免责声明
这些信息和出版物并非旨在提供,也不构成TradingView提供或认可的任何形式的财务、投资、交易或其他类型的建议或推荐。请阅读使用条款了解更多信息。
开源脚本
秉承TradingView的精神,该脚本的作者将其开源,以便交易者可以查看和验证其功能。向作者致敬!您可以免费使用该脚本,但请记住,重新发布代码须遵守我们的网站规则。
免责声明
这些信息和出版物并非旨在提供,也不构成TradingView提供或认可的任何形式的财务、投资、交易或其他类型的建议或推荐。请阅读使用条款了解更多信息。